


DAT is reporting flat to downward movement in the national spot markets of all 3 modes of transportation in the truckload sector. Van rates dipped $.03 per mile with flatbeds coming in flat and reefer rates diving $.04/mile on average. For those of you who have been reading FreightWaves over the last few weeks you may have seen this trend coming. Tender Rejection Indices (TRIs) in some high-volume cities such as Atlanta, Chicago, and Los Angeles have been showing reduction in the number of loads being turned down by carriers. The TRI tends to lead the spot market which corroborates what DAT is reporting.
In previous articles we have targeted specific cities as examples of TRI movements leading to a decrease or increase in spot rates. Now we are seeing the impact of a falling rate of rejection of loads tendered nationally.

You can see a period of decline in nationwide tender rejections around March 25th. The reduction in rates has come as a bit of a surprise to many who watch freight trends as they were expecting the hard enforcement ELD period to have a more dramatic impact in the near term to rate volatility. What they had not realized is the market had plenty of foresight into this event so the spike in rates occurred earlier in the year as bid cycles were nearing their conclusion and carriers were heading to shippers with increases on the contract side.
The increasing cost coming from the ELD implementation was not the only variable factored in to the contracted rate increases. There were many other variables that stemmed from the previous year included in the new rates as there was a lot of volatility in freight markets in 2017. Companies like General Mills cited increased transportation costs as one of the reasons the company missed quarterly earnings.
Each market felt these events in different ways. This inconsistency is recognized in the variability of movements in each market. The outbound TRIs in Chicago and Atlanta are good examples of how cities’ near-term patterns can move differently, but the longer-term trend can be similar.
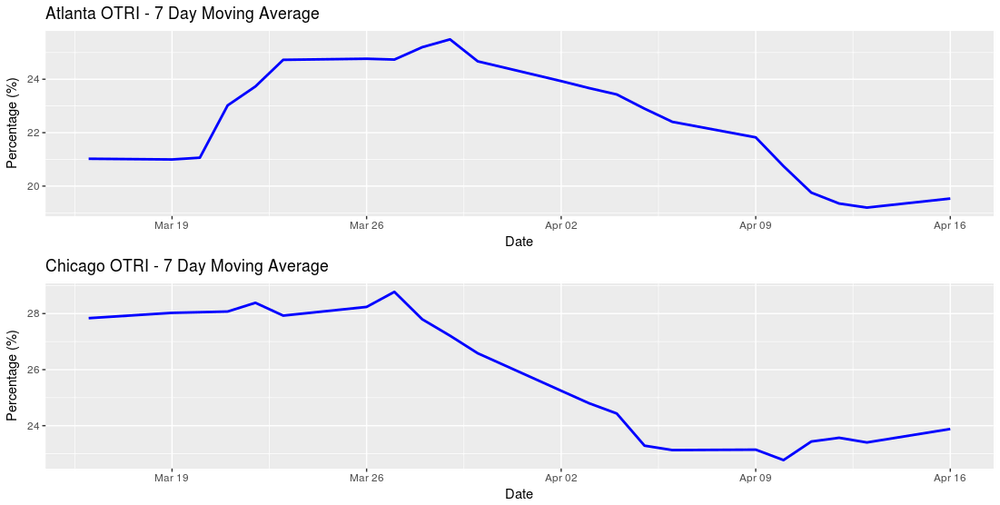
You can see carriers were turning down Chicago origin loads at a constant rate in mid-March when Atlanta saw a surge in tender rejections. Over the last 20 days, the two cities’ rejection trends have been more strongly correlated but maintained some independent movement within the trend.
Another interesting aspect of this downward movement of the OTRI, and subsequently rates, is that this is typically the time of year freight begins to show increases in volatility as volumes surge. 2018 to this point has run somewhat counter to typical freight trends with volatility and rates climbing in January and stabilization resuming as we enter the spring.
You should note that stabilization does not represent a weak market, as volumes are not falling. The stabilization is a result of carriers assimilating the market information more efficiently. The higher rates they implemented in the early spring are making it more feasible for carriers to remain in the contract market with their trucks. The TRI shows us that the contract market was under-priced, and therefore more activity and volatility spilled into the spot market.
Stay up-to-date with the latest commentary and insights on FreightTech and the impact to the markets by subscribing.
