


Ocean shipping hit myriad all-time highs in 2021, and just days before the new year, there’s no sign yet of a return to pre-COVID normalcy.
Following are charts covering both container shipping and bulk commodity shipping that highlight how unusual this year has been:
No. 1 — Shipping stocks
Shipping equities have scored big in the COVID era.
Shipping stock indexes are published by New York-based communications and advisory firm Capital Link. Capital Link’s container shipping index outperformed the pack, up 242% year to date as of Tuesday.
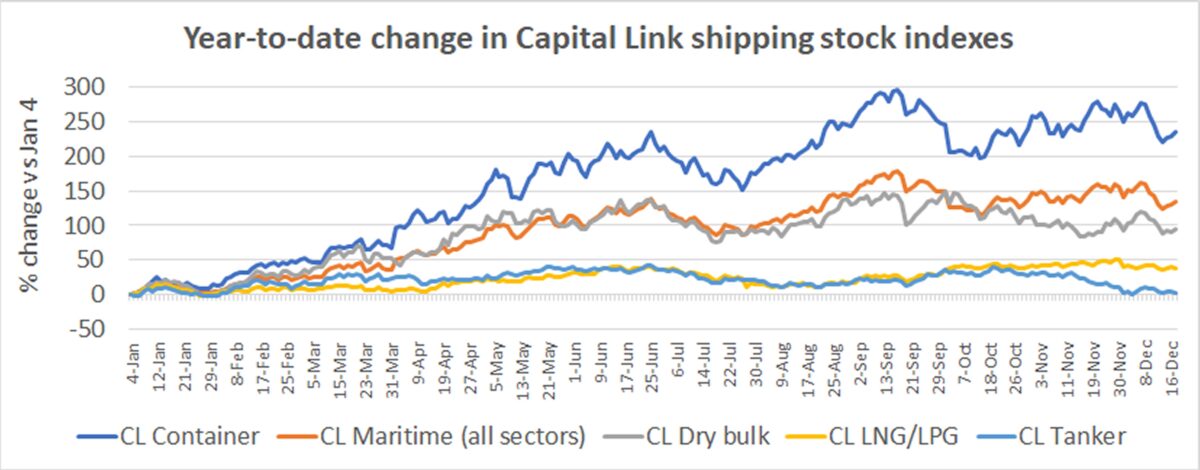
The Capital Link Maritime Index, which covers stocks of all vessel segments, was up 138%, while the dry bulk index was up 97%.
Tankers and gas carrier stocks lagged. Capital Link’s gas carrier index was up 43% year to date as of Tuesday, with the tanker index giving back almost all of its earlier gains and up only 4%.
No. 2 — Container spot freight rates
Why did container stocks do so well? The initial driver was spot container freight rates, which subsequently drove up ship charter rates and contract freight rates.
Drewry’s weekly spot index reveals how extreme the rise has been. Even after a slight pullback recently, Asia-West Coast spot rates are still five to 10 times where they’ve been over the past decade.

No. 3 — Container-ship charter rates
The more ships that ocean carriers operate, the more boxes they can carry and the more they profit from stratospheric freight rates. This dynamic pushed ship charter rates to record highs as carriers scrambled to secure leased tonnage.
As with freight rates, charter rates recently dipped slightly from extreme highs. Now rates are going back up again.

According to Alphaliner, 2021 “will be remembered as a historic year for the charter market, with all-time high demand, a continuously tight supply and record-breaking rates. Time-charter rates are bouncing back, and in some cases improving on their previous highs, putting an end to a recent softening trend.”
No. 4 — Maritime imports customs filings
What got the ball rolling, pushing up spot freight rates, and in turn, charter rates? Consumer demand for goods, particularly in the U.S.
Customs data on the number of import shipments per day highlights the continued strength of that demand.
The rush to get goods into the country for Christmas is over, but even so, the number of daily import shipments remains near all-time highs and is up 40% from the same time two years ago, pre-COVID.

No. 5 — Inbound ocean bookings
The customs data shows what just arrived. Other data signals what’s coming.
FreightWaves’ SONAR platform features a proprietary index of shippers’ ocean bookings measured in twenty-foot equivalent units as of the scheduled date of overseas departure, indexed to January 2019.
The bookings index is a bellwether of U.S. import volumes several weeks ahead, when ships from export destinations arrive at American ports. The index peaked in May at around 250, fell to around 150 in November and has now bounced back to over 200, pointing to continued very strong volumes in the first quarter of 2022.

No. 6 — Ships waiting for LA/LB berths
The freight rate, charter rate, customs and ocean booking data all imply that the supply chain squeeze is far from over. Each of these numbers remains close to its all-time high.
Yet another gauge of supply chain pressure: the number of container ships waiting for berths at the ports of Los Angeles and Long Beach, which handle around 40% of U.S. containerized imports. The bigger this queue number, the more U.S. inventories are in transit versus available for sale.
The queue off Southern California ports reached an initial peak in Q1, fell back in Q2, then climbed to new heights in Q3 and into Q4, far surpassing Q1 highs.

As of Tuesday, there were 91 container ships in the Pacific queue. The count has been above 90 since Nov. 23, peaking at 102 on Dec. 15.
Industry expert Lars Jensen on container-shipping congestion:
No. 7 — Dry bulk spot rates
Container shipping grabbed the headlines in 2021, but it was also an exceptionally good year for dry bulk shipping, as shown in the strong performance of dry bulk stocks.
Spot rates for Capesizes (bulkers with capacity of around 180,000 deadweight tons or DWT) surged to $87,000 per day in early September and then plummeted; they were $20,400 per day as of Wednesday, according to Clarksons Platou Securities. That’s still several thousand per day above where rates normally are at this time of year.
Rates for Panamaxes (65,000-90,000 DWT) hit a decade high of $36,300 per day in late September and were down to $20,800 per day on Wednesday, still around $10,000 per day better than the 2016-2020 average for this time of year.
Rates for Supramaxes (45,000-60,000 DWT) reached a decade high of $39,900 in late October and are down to $26,200 per day, still over 2.5 times better than where they normally are at this time.

No. 8 — Crude-tanker spot rates
In contrast to other shipping sectors, 2021 has been exceptionally bad for crude tankers. Rates remain far below normal. Crude tanker owners continue to bleed cash.
As of Wednesday, Clarksons put rates for 10-year-old very large crude carriers (VLCCs, tankers that carry 2 million barrels) at just $8,400 per day, with older Suezmaxes (1 million-barrel capacity) at $11,400 and Aframaxes (750,000-barrel capacity) at $13,400.
Whereas dry bulk rates have been well above their 2016-2020 average throughout this year, crude tankers have suffered the reverse pattern: Rates are far below the five-year average. At this time of year, VLCC rates should be around $50,000 a day, more than five times current levels. Suezmax rates are normally around $35,000 and Aframax rates $30,000, more than double current levels.

No. 9 — Ship sales
Yet another reason that 2021 stands out: An extraordinary number of vessels traded hands in the secondhand market.
As of mid-December, Greece’s Allied Shipbroking counted 1,897 vessel sales year to date, with aggregate capacity of 130.84 million DWT. That’s well above the totals in any year since the financial crisis and 32% higher, measured in DWT, than the previous decade high in 2017.

Container-ship sales were driven by high freight rates. Carriers sought to increase upside exposure to rates not just by chartering ships but also by acquiring them. MSC was by far the leading purchaser.
Sales were also high for bulkers and tankers — particularly bulkers. According to Allied data, tankers sales (measured in DWT) were up 32% versus the same period in 2019, pre-COVID, with bulker sales shooting up 81%.
No. 10 — New ships on order
One reason for higher bulker and tanker secondhand sales: It makes more sense to buy existing ships than to build new ones, given high newbuild prices and uncertainty over future environmental regulations. Also, as 2021 progressed, heavy ordering of new container ships and gas carriers filled up yard slots, blocking orders for other vessel types and pushing owners to the secondhand market.
Data from Clarksons Platou Securities reveals a stark split in this year’s orderbook. At one end of the spectrum, container-ship capacity on order now equals 22.8% of tonnage on the water, with the ratio for fully refrigerated LPG carriers up to 24% and for LNG carriers to 29.2%. Those levels imply headwinds for rates when new ships are delivered.
On the other end of the spectrum, the order-to-fleet ratio is a mere 5.7% for product tankers, 6.9% for bulkers and 7.9% for crude tankers as 2021 comes to a close. These are historically low levels of new ship orders, implying continued strength for bulkers in the years ahead and offering promise of future relief to beleaguered tanker owners.

Click for more articles by Greg Miller
Related articles:
- About that rate relief … ocean shipping costs are rising again
- Los Angeles import volume sinks as shipping traffic jam worsens
- COVID-era shipping stocks: The (super) good, the bad and the ugly
- It’s official: 96 container ships are waiting to dock at SoCal ports
- Ships in California logjam now stuck off Mexico, Taiwan and Japan
