


FreightWaves features Market Voices – a forum for voices with unique knowledge of numerous transportation/logistics/supply chain sectors, as well as other critical expertise.
Changes are afoot. Precision Scheduled Railroading (PSR) is the latest marketing mantra.
Rumors of line rationalizations are circulating, as are cutbacks in local service frequency and railyards closing. Therefore, plant siting decisions are at some risk until strategic railroad network and yard change patterns settle in.
What could these changes possibly mean to your service locations?
If you’re a long-time rail freight customer with some plants and warehouses aging – and questions within your own organization about where to locate replacement facilities – how do you evaluate your location options?
If you are new to railroad freight, how do you establish a site check list?
Here are a few suggestions for both circumstances.
The Class I railroads offer industrial real estate assistance. They have land maps, labor and utility cost index data, and related materials to offer. However, the real estate departments are not the railroads’ strategic planners. Employees in those departments may or may not be in the inner circle of “high level network rationalization.”
State departments of transportation (DOT), major utilities, ports and local communities also offer help in site planning. However, they are not likely to have knowledge about pending railroad network changes.
Beyond these choices, consider these next steps as prudent due diligence.
First, consider public domain documents useful in helping to define the sustainable freight rail network core. In the hands of skilled railroad cost experts, that kind of data can signal geographic shifts ahead.
For this task, a key source is the quarterly reports to investors. Railroads target that audience with useful intelligence about their likely market and operational changes. It is often surprising how much strategy they reveal. Assembling a file of successive quarterly reports may provide information about potential changes in market and network geography.
For a deeper look, check text published in railroads’ periodic filings with the Securities and Exchange Commission (SEC). Always examine the footnotes. Intelligence is often hidden in plain site within the smaller font footnotes.
Monitor the changes in the railroads’ multiple year debt structure and announced capital plans. You’re looking for a pattern. That requires consistent note taking and locational cross-checking over multiple years… maybe longer. You’re looking for a change in pattern, location and operating practice that tells a story. A review of the last half-year to year is insufficient coverage. Due diligence is not a quick task.
Check how freight schedules of the services you require are being modified. Announced intentions of higher quality and service by lane should be examined in terms of your strategic corridors – by railroad lanes.
Your receiver dock files are likely the critical indicators of reliability changes. Check the AEI rail car tag records for actual delivery performance – in contrast to constructive placement and EDI recorded records. What are the real service and car cycle patterns your plants are receiving?
In the digital age, strategic plant site and industrial real estate decisions are still about location, location, location…
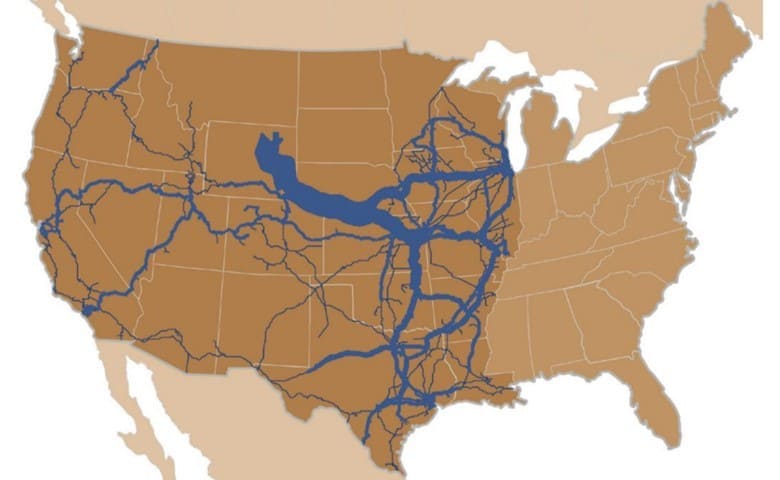
Various technical density maps are the next recommended source. They are rich in intelligence – if you learn how to interpret them over time periods.
Railroads periodically publish density maps that show freight volume over their strategic corridors. Where do you find such maps? They are found most often in a railroad’s Fact Books or in some specific commodity group corporate presentations. The map images are a specific statement of a railroad’s key routes. But changes over time can be spotted if you know where to look.
Corridors that demonstrated shifts to significantly lower traffic density in recent years are one of the footprints you’ll need to interpret. As an example, what’s a drop of 20 percent or more in traffic density like gross revenue ton-miles (GTM) via one of five New Orleans’s rail routes mean? You will need more than the gross-ton miles indicator and timeline to translate that data point. Nevertheless, it’s a metric to consider.
What if that data isn’t published officially by the railroad company you are considering as your long-term vendor at a site?
There are third-party resources that track such traffic changes. You may need to seek railroad operational expert help.
State DOTs and their rail planning staff monitor rail company GTM changes, normally on an official basis since the railroad companies keep close with them in order to obtain periodic public/private participation project funding. Be aware that the state industrial development staffs might not know about or how to use that strategic density change data. Therefore, you may have to request that they talk to their DOT mates.
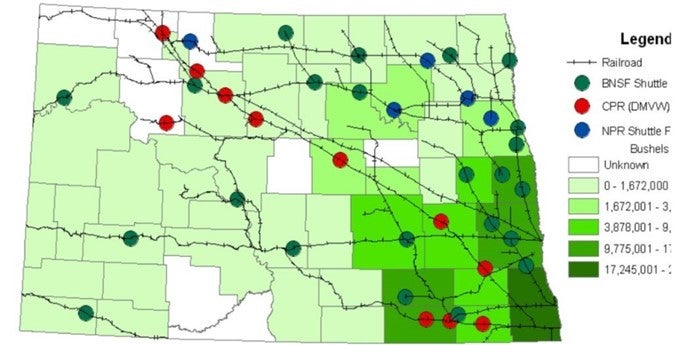
Here is one example of state assistance. It is a South Dakota State Railroad Plan Map of Strategic Railroad-Served Shuttle Train Elevators. Some are located on very light density lines. Some sites may lack well-engineered rail track, ballast and ties for 286,000-pound loaded grain cars.
In the absence of railroad or state sources, third-party consultants can offer a series of calculated traffic pattern insights.
You will need to determine future trends regarding your sites. The important part isn’t the history; its interpreting and projecting future shifts. That involves interpolating the historic patterns against the evolving new railroad business model.
Remember that past is not necessarily prologue with pending PSR shifts. Dramatic shifts in commodities like thermal coal has disrupted our view of future railroad traffic flows.
Who has the most at stake if rail service patterns change significantly by geography? Heavy product and bulk commodity shippers are most impacted by possible network changes. This includes:
- Power utility transformer and emergency supply distribution centers
- Warehousing hubs and project port cargo shippers
- High and wide industrial loads exceeding 20-foot height and 14-foot widths
- Heavy axle loadings between 286,000 and 315,000 pounds per car – or higher
Conclusion and Sources
The conclusion is that there are insightful text and graphics in the public domain upon which to judge your specific rail freight locational strategy.
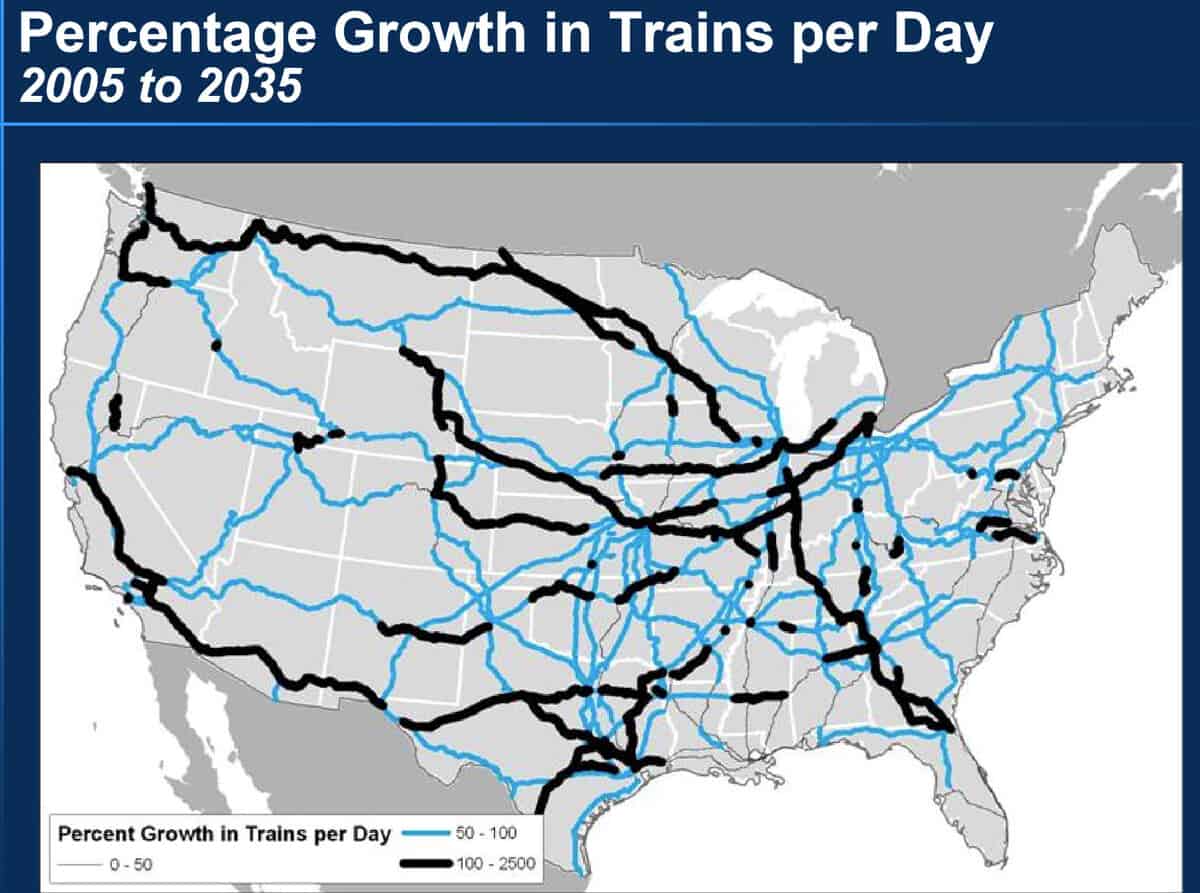
Be alert please. Not all published maps are still valid. This map with a projected change in traffic volume out to the year 2035 was well-researched and presented when published a little over a decade ago. But it is out of date because of changes in the market and the restructuring that railroads have undergone – and will continue.
Beyond the few images in these pages, here are selected internet sites. They will direct you to copy protected images from sources I highly recommend after decades of professional subscription use. You will not see the entire graphics, but you will get a technical impression of their possible utility.
- Kalmbach Publishing and Trains Magazine has a diversified set of railway network density and business location maps. One is for coal power stations found at this URL: http://trn.trains.com/railroads/railroad-maps/2012/04/coal-plants-of-the-northeast-2002
- Another is for plotted GTM and/or trains per day across the U.S. railway network: http://trn.trains.com/railroads/railroad-maps/2012/04/union-pacific-trains-per-day-2001
- and also changes during the heavy growth of western coal, found at: http://trn.trains.com/railroads/railroad-maps/2012/04/western-mainline-tonnage-growth-1979-to-2001
- U.S. Railroad Traffic Atlas Staple Bound – Recent Years – by Harry Ladd
- SPV’s comprehensive Railroad Atlas of North America: Regional sets – recent years
Dave Kruschwitz
Hey Jim, isn’t that a map of North Dakota, not South Dakota?
Ben irwin
Yep it is. LOL!