


FreightWaves’ SONAR chart of the week (July 7, 2019 – July 13, 2019)
Chart of the Week: Dry Van Orders and Durable Goods Orders (excluding transportation) – National (SONAR: ORDERS.VAN, ORDR.DGXT )
Dry van monthly trailer orders hit their lowest total in over five years in May after recording the highest volume in over five years last September. Durable goods orders, excluding transportation, are also trending lower for the first time since 2014-15. Dry van orders indirectly report the health of the trucking industry and subsequently the freight market. When carriers are doing well they have more money to invest in growing their fleets and trailer pools for servicing customers. Over the last few months, the orders for the items that fill most of those trailers, durable goods, have stalled.
Durable goods are the items that are not for immediate consumption and can be stored for a period of time. These are non-food items that make up most of the freight moved in the U.S. When there are increasing orders, there is an increasing demand for equipment to haul the orders. Currently, durable goods numbers are have taken a sharp right-hand turn in the second half of 2018 before slightly declining this year.
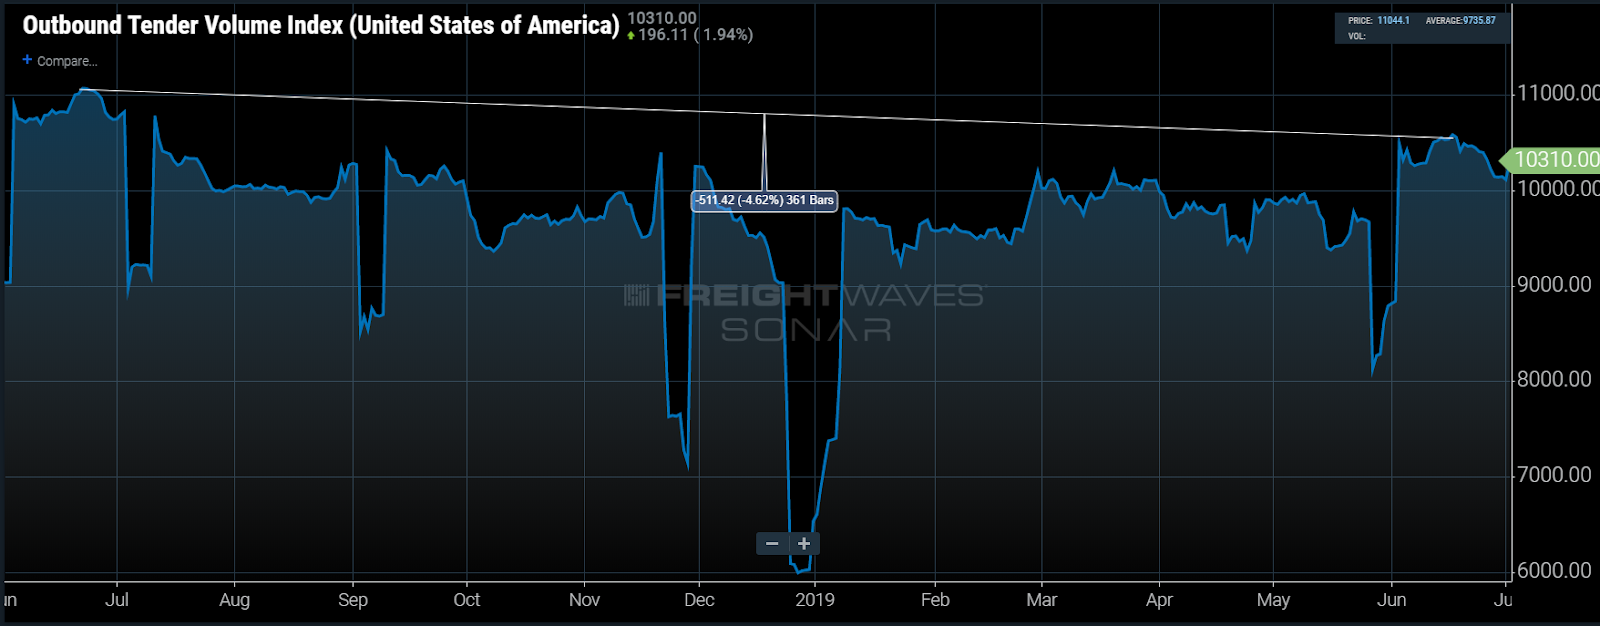
As the economy slows, freight movements tend to follow course with many companies investing less in capital expenditures or as they are called economically speaking, capital goods. Most of the current data suggest there has been a decent drop in freight shipping from 2018 to 2019. May and June volumes averaged 4% lower than 2018 according to the national Outbound Tender Volume Index (OTVI). March and April only averaged 1.5% off of last year, an indication freight demand is weakening at an increasing rate.
With so much freight moving last year, and carriers getting an added incentive to invest in fleet growth with the accelerated depreciation tax cut, trailer and class 8 truck orders hit new highs. Dry van orders topped 38,343 in September of 2018—the next highest order month was December 2017 which was 17% lower.
Looking at the durable goods orders many other industries increased their investment in capital goods as well with order amounts over pre-recession levels throughout 2018. The side effect of the incentivized investment along with geopolitical events such as the trade war with China created a front-loaded bubble, not only in trucking, but the economy in general. That bubble appears to be deflating like a balloon whose knot was not properly tied.
The seasonal bottom for trailer orders typically occurs around May through July each year, where we currently sit. This bottom is happening in the early edge of the cycle this year it would seem as orders dip to 4,313 in May, 1.5% below the 5-year low that occurred in July of 2016. Considering May has only been the bottom in one other year in the last five, this might not be the low month in 2019.
The current environment is a product of rapid expansion, both economically and inside the trucking sector. As companies were incentivized to invest in 2018, the economy grew at what many economists would say is an unsustainable level. Many companies such as the truckload carriers were purchasing goods that may not be needed due to the short-term tax benefits. Increased investment was a self-perpetuating cycle that has lost steam. Without a significant event, excess capacity will continue to be a theme in the back half of 2019 as the market corrects.
About Chart of the Week
The FreightWaves Chart of the Week is a chart selection from SONAR that provides an interesting data point to describe the state of the freight markets. A chart is chosen from thousands of potential charts on SONAR to help participants visualize the freight market in real-time. Each week a Market Expert will post a chart, along with commentary live on the front-page. After that, the Chart of the Week will be archived on FreightWaves.com for future reference.
SONAR aggregates data from hundreds of sources, presenting the data in charts and maps and providing commentary on what freight market experts want to know about the industry in real time.
The FreightWaves data-science and product teams are releasing new data sets each week and enhancing the client experience.
To find out more about SONARgo here or to setup a demo click here.
