


So many of the questions and concerns about the economy that are regularly voiced by the media, and routinely parroted by individuals, are expressions of fear that are not rooted in any fundamental data, or at least not any serious study of the fundamental data.
As a result, it is easy to oscillate between incredibly frustrated and extremely amused when trying to answer their questions about the economy. To make rational sense of these questions, it is useful to segregate the economy into three parts – technology, consumer and industrial; and then further separate it into domestic and international. Using this construct allows us all to have a clear dissection of the concerns and the data.
As is often the process when studying anything economic, almost all (if not all) of the variables are dependent (or interdependent). That said, over the next three weeks, I will endeavor to review each of the three segments, starting with the Industrial Economy. The Industrial Production year-over-year (YOY) change data, available on FreightWaves SONAR under the symbol IPROG.USA (below), is a great place to start when assessing the strength of the U.S. Industrial Economy.
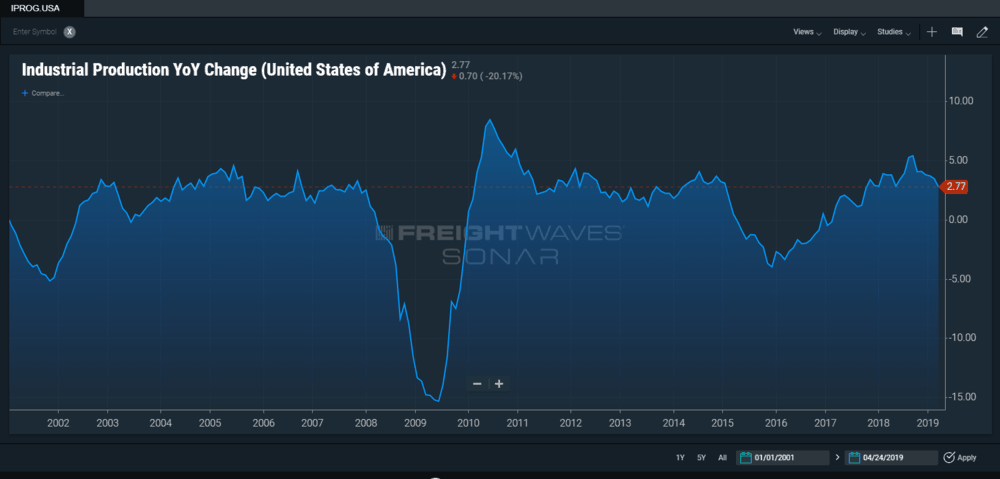
Last year the growth in this segment was so strong, the rate of expansion was literally straining the infrastructure in place to such an extent that there were signals of inflation being produced (albeit, signals that later proved to be false positives, but signals nevertheless). With such a backdrop, it would be easy to misdiagnose the current U.S. Industrial Economy as less healthy than it actually is, especially when only looking at the current rate of percentage change versus the rate of percentage change at this time last year.
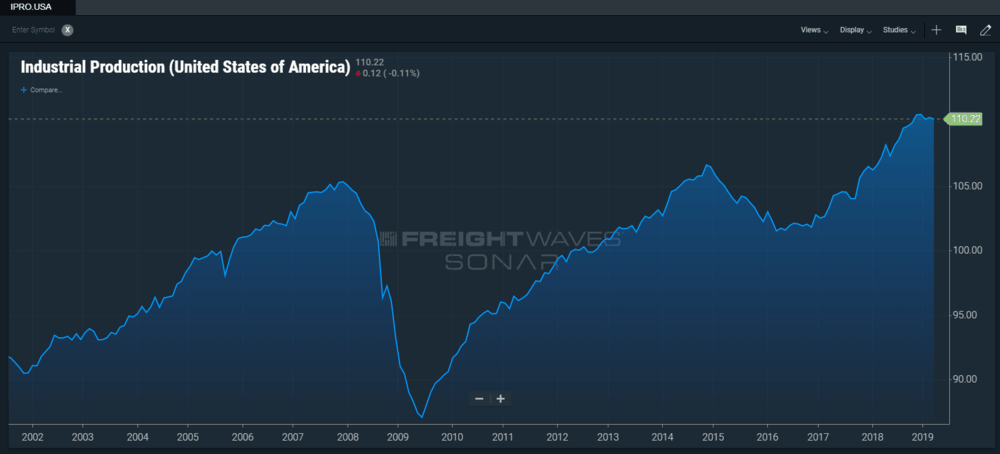
Looking at the same data on a nominal basis, available on FreightWaves SONAR under the symbol IPRO.USA (below), provides a better perspective on the current conditions in the U.S. Industrial Economy. Still strong, but not growing at the unsustainable pace that it was last year.
What is the bottom line?
The 2009 through 2014 time-frame was the first recovery led by industry in the U.S. since 1961. This industrial activity was driven by fracking, and the success of that industry resulted in the dramatic expansion in the infrastructure and earnings of railroads, the chemical industry, the plastic industry, pumps and cranes, domestic machine tool and die companies, to name a few. This activity came to a screeching halt in the fall of 2014 as the price of oil fell dramatically below the marginal cost of its production via fracking. As oil climbed back above $45 per barrel in the fall of 2016, fracking activity resumed and the industrial ‘mini-recession’ ended. Coincidentally, equity markets began to reflate and millennials finally began to form households in meaningful volumes. Today, with West Texas Intermediate crude oil back above $65 per barrel, fracking is profitable in all the U.S. fields of any significance and activity is increasingly robust as a result. This is very bullish for the U.S. Industrial Economy.
Where are we in the cycle?
Obviously, this isn’t the beginning of the recovery with the economy just starting to climb out of the recession as it was in 2010 and 2011, but with the ‘mini-recession’ of the Industrial Economy just ending in the fall of 2016, we aren’t into the mature years of the industrial cycle. Since consumers really didn’t recover from the 2009 recession and spent almost six years in a slow-growth, no-growth mode, it certainly isn’t in the mature years of the consumer cycle either (the consumer economy will be dissected in this column next week). To use a baseball analogy, not the first three innings of the game, but not the last couple of innings either.
