


FreightWaves’ SONAR chart of the week (June 16, 2019 – June 22, 2019)
Chart of the Week: Drewry World Container Index – Shanghai to Los Angeles and Shanghai to New York (SONAR: WCI.SHALAX, WCI.SHANYC )
If you are involved in the movement of containerized ocean freight, you are undoubtedly familiar with the beast known as the Trans-Pacific Eastbound (Trans-Pac Eastbound). The Trans-Pac Eastbound is the given name for regional trade lane for ocean containers that originate in East Asia and are shipped across the Pacific Ocean, destined for the U.S. For at least the last ten years in the ocean container trade, this trade lane has reigned supreme as the most important for U.S. importers, with over 20 million twenty-foot equivalent units moving each year since 2012. In fact, no other container trade lane for U.S. imports even comes close to moving the amount of container volumes that this lane is responsible for.
Over the last couple of years, with ongoing trade war between the U.S. and China, this trade lane has experienced a great deal of volatility that it has not seen since the labor issues at Port of Los Angeles in 2014-15. This port is the largest-volume destination port in the U.S. for containers moving on the Trans-Pac Eastbound, and these labor issues caused major disruptions in the flow of containers from East Asia to the U.S., leading to the lowest container rates in recorded history from Shanghai to Los Angeles and arguably to the bankruptcy of Hanjin in 2016.
Now, the Trans-Pac Eastbound faces a high level of uncertainty as the trade war continues to intensify and the prospects of an additional round of $300+ billion of Chinese-made goods seems likely. This uncertainty has ocean carriers on “high-alert” and painfully aware of the amount of vessel capacity (supply) they have operating in this trade lane. Since the port strikes in 2014-2015, these carriers have formed alliances that have helped to mitigate substantial rate decreases through a greater balance of supply in vessel capacity. These three major alliances (THE Alliance, The Ocean Alliance, and 2M + H) work separately and among their member partners to share vessel space with one another so that they are not competing against one another on price quite like they were before the Hanjin bankruptcy. They have also utilized “blank sailings/skipped sailings” to assist even further in balancing the amount of supply in the market relative to overall container demand.
For these reasons, it can be argued that the major ocean carriers are now more sophisticated at maintaining this balance of supply and demand, which has led to greater rate predictability in the container spot-market on the Trans-Pac Eastbound.
Spot pricing for a 40 ft. Container on this lane is normally broken out in two divisions: rates to the U.S. West Coast and rates to the U.S. East Coast. Then, we take a look at the largest ports in terms of volume at origin and destination, which in this case are Shanghai, China at origin (East Asia) and Los Angeles (West Coast) and New York/New Jersey (East Coast) at destination.
Since these port pairings represent such a massive percentage of overall volumes on this trade lane, the 40 ft. container rates for these port pairings have become one of the best ways for us to benchmark these rates year-over-year. This is especially true when using the Drewry World Container Index (WCI.SHALAX, WCI.SHANYC) within SONAR, coupled with the seasonality display to view both current and historical rates for these lanes back to 2016.
This view of the index makes it clear that the market has grown accustomed to accepting a General Rate Increase (GRI) on July 1 and August 1 each of these years. While these historical rate increases are not enough to declare definite predictions of how rates will move, I would argue that when coupled with the knowledge of the high possibility of the next round of tarrifs, and the reaction by U.S. importers to rush and pull demand forward as they did in 2018, there is an even greater likelihood of these GRIs being implemented as they have in the past. This point is only further supported by the wide-ranging view that the ocean carriers are much better at maintaining a better balance between supply and demand.
By examining Bluewater Reporting’s capacity report, we can actually measure the amount of supply in the market along with year-over-year capacity trends on the Trans-Pac Eastbound. According to the report, “between May 2017 and May 2018, estimated allocated TEUs on the trade increased 11.4% from 397,419 TEUs to 442,858 TEUs. In contrast, between May 2018 and May 2019, estimated weekly allocated TEUs on the trade dropped 5.1%, from 442,858 TEUs to 420,430 TEUs.” Since supply on this trade lane has decreased, it is an indication that carriers have reacted quickly to some market analysts’ views about the potential for decreased demand on this lane in the short-term, but now that the next round of tariffs are likely, I would expect them to add a bit more capacity once demand increases in the form of a pull-forward similar to Q4 of 2018 along with the normal seasonal, holiday-driven demand known as peak season.
But if I am right in these predictions about the future of supply and demand on the Trans-Pac Eastbound, by how much will the ocean carriers be able to raise prices, and will they be able to maintain these increases? Or, will the rates quickly drop after the GRIs are implemented by the alliances competing to undercut one another and offer the lowest price for a 40 ft. container?
I believe that on both July 1 and August 1 there will be a GRI of $250-350, with it being unlikely that these rates receive GRIs on the 15th of either of these months. It is also likely that after the July 1 GRI, rates will decrease slightly throughout the month, with a decrease of around $100-200 overall during this period. Then, once the August 1 GRI is implemented, rates will likely hold steady throughout the month, with only a slight decrease of $50-100. This should have rates from Shanghai to Los Angeles for a 40 ft. container around $1650-1750, and rates from Shanghai to New York around $2750-2850 by the end of August. From there, we will be moving further into the middle of peak season where rates will likely receive increases of $150-250 on September 1 and $100-200 on October 1. Another rate increase in November is a possibility but would likely be difficult to implement, as there is substantial volume that is supposed to be pulled forward from additional tariff concerns. From there, rates should be at or close to their peak for the year unless there is any additional uncertainty brought into the mix by outside forces (geopolitical, economical, etc.).

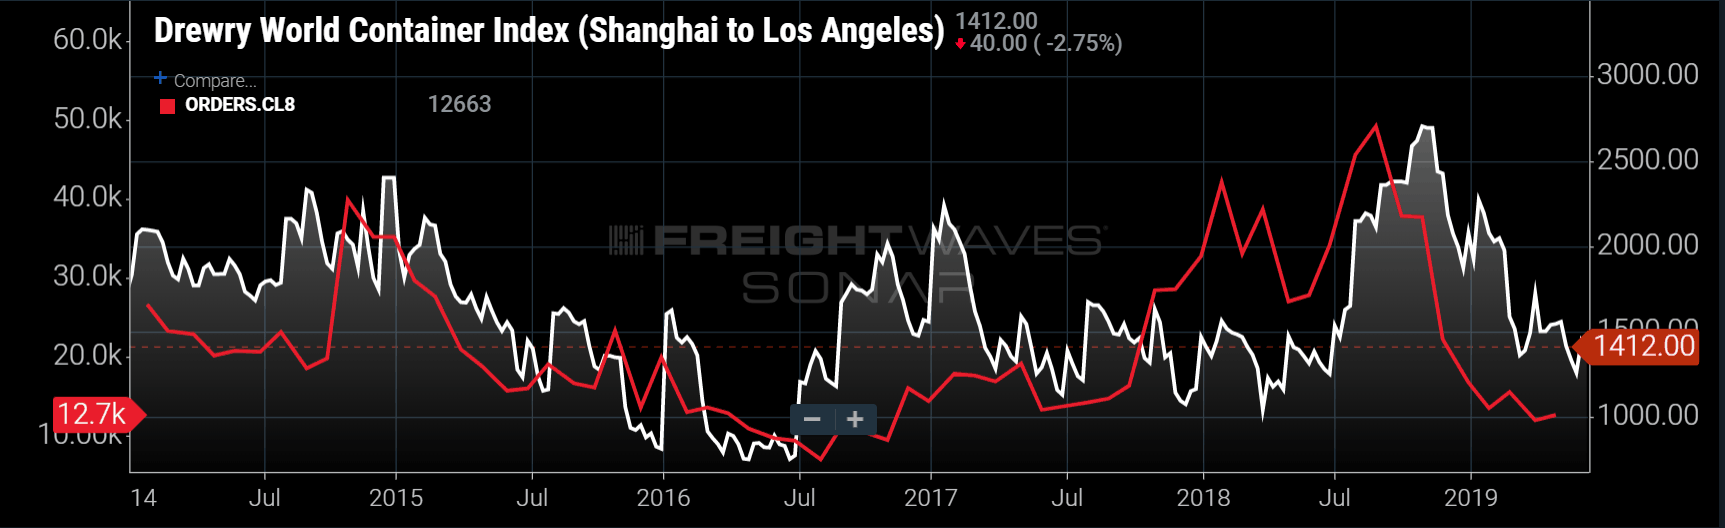
As we have seen over the last year, any major increases in demand and container spot rates on the Trans-Pac Eastbound can have a substantial impact on truckload volumes and truckload spot rates. If truckload spot rates are to increase, then it can have a major effect on new Class 8 truck purchases. So, if we we examine container rates from Shanghai to Los Angeles in relation to truckload spot rates and Class 8 truck orders from 2014 to 2019, we can see that there is a high likelihood that if container rates go up as anticipated through most of the end of 2019, then truckload spot rates will go up as well. It is worth noting that since new Class 8 truck orders have a lag in production time of 6-8 months, most of this new capacity has entered the truckload market within the last few months. Since this would mean there has been a major increase in overall capacity (supply) in the truckload market, truckload spot rates may not increase nearly as much as they would if there were less capacity on the road.

While these rate predictions can be affected by additional uncertainty in the marketplace (i.e. an additional bankruptcy or merger/acquisition among the major carriers), if current market conditions continue on their current path, the overall accuracy of these predictions will increase. It is not always as simple as viewing historical rate patterns along with supply and demand, but based on the available data, it is a good methodology for forecasting future rate levels.
One thing is certain: as long as trade is being used as a negotiating tool, companies with supply chains will struggle to keep costs manageable. The U.S. freight market is heavily dependent on goods coming from outside its borders, and policy changes more rapidly than companies can shift their supply chain infrastructure.
The FreightWaves Chart of the Week is a chart selection from SONAR that provides an interesting data point to describe the state of the freight markets. A chart is chosen from thousands of potential charts on SONAR to help participants visualize the freight market in real-time. Each week a Market Expert will post a chart, along with commentary live on the front-page. After that, the Chart of the Week will be archived on FreightWaves.com for future reference.
SONAR aggregates data from hundreds of sources, presenting the data in charts and maps and providing commentary on what freight market experts want to know about the industry in real time.
The FreightWaves data-science and product teams are releasing new data sets each week and enhancing the client experience.
To find out more about SONAR go here or to se tup a demo click here.
