


According to Boeing, air cargo as a transport mode carries roughly 35 percent of the world’s trade by value. With such valuable goods-in-transit, shippers expect efficient and timely handling. Any delays are a real concern and airport wait times take on added importance. Earlier this year, FreightWaves introduced composite wait time metrics in SONAR for the largest U.S. airports (WAIT.AIRLOG), as part of an overall wait time metric that included 16 other U.S. industries under measurement (which also includes seaports). In response to client requests, we are now pleased to be able to display driver wait time metrics for the top airports individually.
This process uses geofencing and telematics on trucks to show comparisons between individual airports and seaports. It will also allow SONAR users to track progress over time as airport authorities and air cargo handlers take steps to ease congestion issues that impact wait times. This includes airport access and infrastructure improvements as well as technology and process changes that can speed up the drop-off and pick up process in airport cargo areas.
Twenty airports are shown in this first treemap. The airports with the longest wait times in minutes are shown in the upper left; airports with the shortest wait times are on the lower right. The percent figure shown is the change from the prior week’s observation. Clicking any of the airports listed provides a separate chart with a time-series trend for that airport.

With the exception of the California and Washington season for perishable exports, we are in a slower time of year for air cargo for nearly all other U.S. airports. We would, therefore, expect to see low-to-moderate wait times. The composite U.S. average (WAIT.AIRLOG) is 66 minutes currently. Wait times this past week range from 24 minutes on the low side at Memphis International Airport to 87 minutes in Philadelphia. The airports that typically generate the largest number of wait time complaints are New York JFK, Los Angeles and Chicago O’Hare, and indeed these all show on the left side of the chart, ranging from 66 to 79 minutes. Due to insufficient numbers of observations, we were not able to include breakouts for a few other major airports such as Newark and Boston, but hope to add them at a future point.
The FreightWaves SONAR wait time index name for each airport is simply WAIT.Kxxx with xxx representing the three-letter airport code. These provide wait times based on trucks arriving to load or unload cargo at airports, typically trucks often carrying full truckloads and traveling at least 100 miles to or from the airport. While not encompassing the total universe of trucks and vans making air cargo pickups or deliveries at a given airport, they provide a good high-level representative sampling that is missing within the industry today.
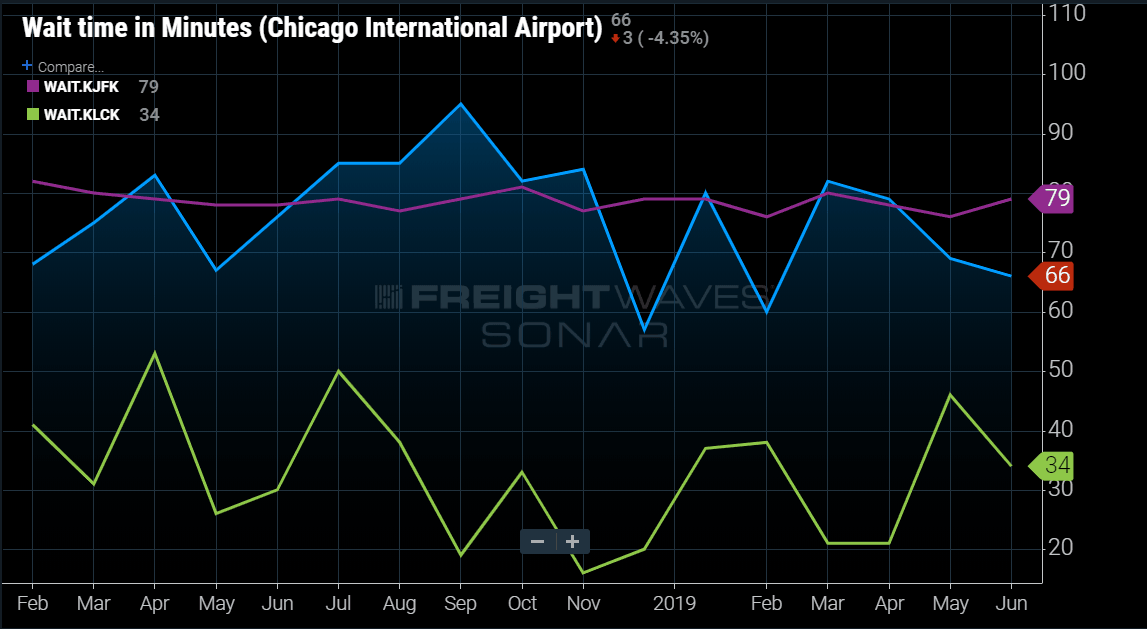
These indices will allow SONAR users to start tracking wait time performance during peak and off-peak seasons at airports, as well as to make useful comparisons between airports. It will also allow smarter pricing for loads as trucking companies can factor in wait times into their cost calculations. The SONAR chart below (WAIT.KORD, WAIT.KJFK, WAIT.KLCK) is a good example of this. SONAR has 16 months of data at this level so far, going back to February 2018. The two large gateway airports, Chicago O’Hare and New York JFK (blue and violet lines), generate many wait time complaints from the industry. They are both trending between 60 and 90 minutes for this time period. But the much smaller Columbus Rickenbacker Airport (green line), which competes with these major gateways for freighter traffic and handles a smaller number of all-cargo operations, ranges between 20 and 50 minutes. This averages out to time savings between 30 to 50 minutes. Chicago appears to fluctuate more based on seasonal air cargo demand highs and lows, such as the fourth quarter of 2018, whereas New York, with many fewer cargo ground handlers, appears to steadily be in the higher end of the range without clearly alternating with volumes.
Overall air cargo wait data is below the 143-minute U.S. average for all industries, but within the air cargo industry, these are new metrics for the industry. FreightWaves will share them with key stakeholders to increase awareness of the industry’s performance around wait times. As these comparisons represent the first national data-driven metrics, they should generate some valuable feedback from various industry stakeholders. Developing and using these new metrics further will help get attention and generate faster solutions to a critical and costly issue important to both truckload and less-than-truckload carriers that deliver and pick up from airports.