


FreightWaves added more features than ever before in the latest release of its SONAR data platform. The following new features and data have been added:
Feature Releases
- Critical Event Center
- Calendar (located under News)
- Video
- SONAR Analytics – Market Volatility Table
- Moderated chat
- Market Insights and research
- Ability for users to upload certain data sets and map information
- Class 1 rail mapping
Data Releases
- Digital momentum signals
- Stock prices
- Publicly traded company financial data
Critical Event Center
SONAR now has a new critical event center that adds a layer of detail and usability to getting the latest weather and natural disaster information so users can react as quickly as possible.
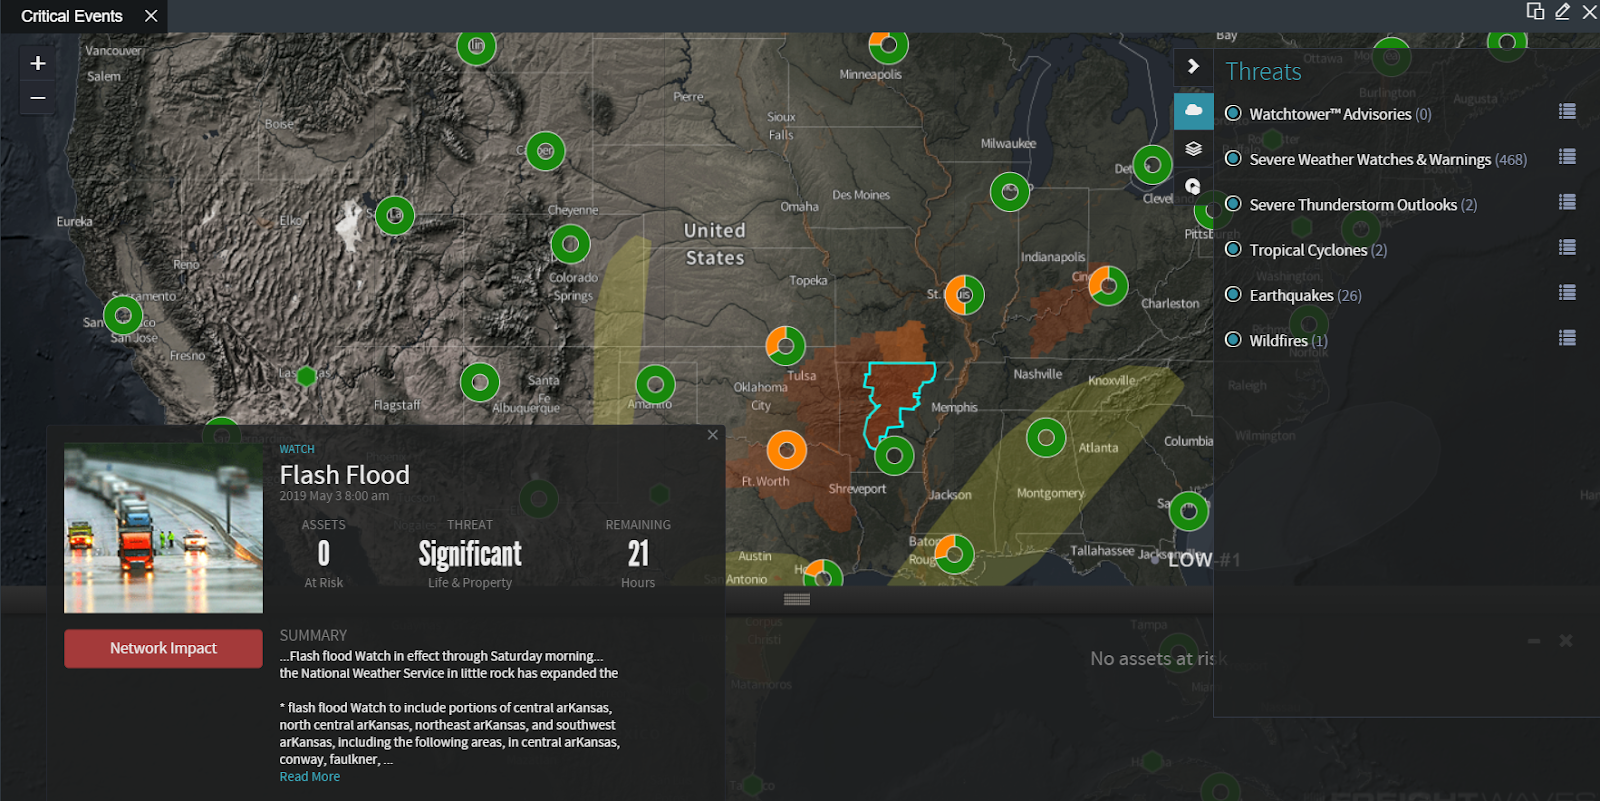
Weather has a huge impact on transportation as severe events can wreak havoc on trucking networks for months after they occur. The day to day impact of severe weather can ruin an entire month for carriers, but also present significant opportunities if handled appropriately. Users can do the following inside the critical events center:
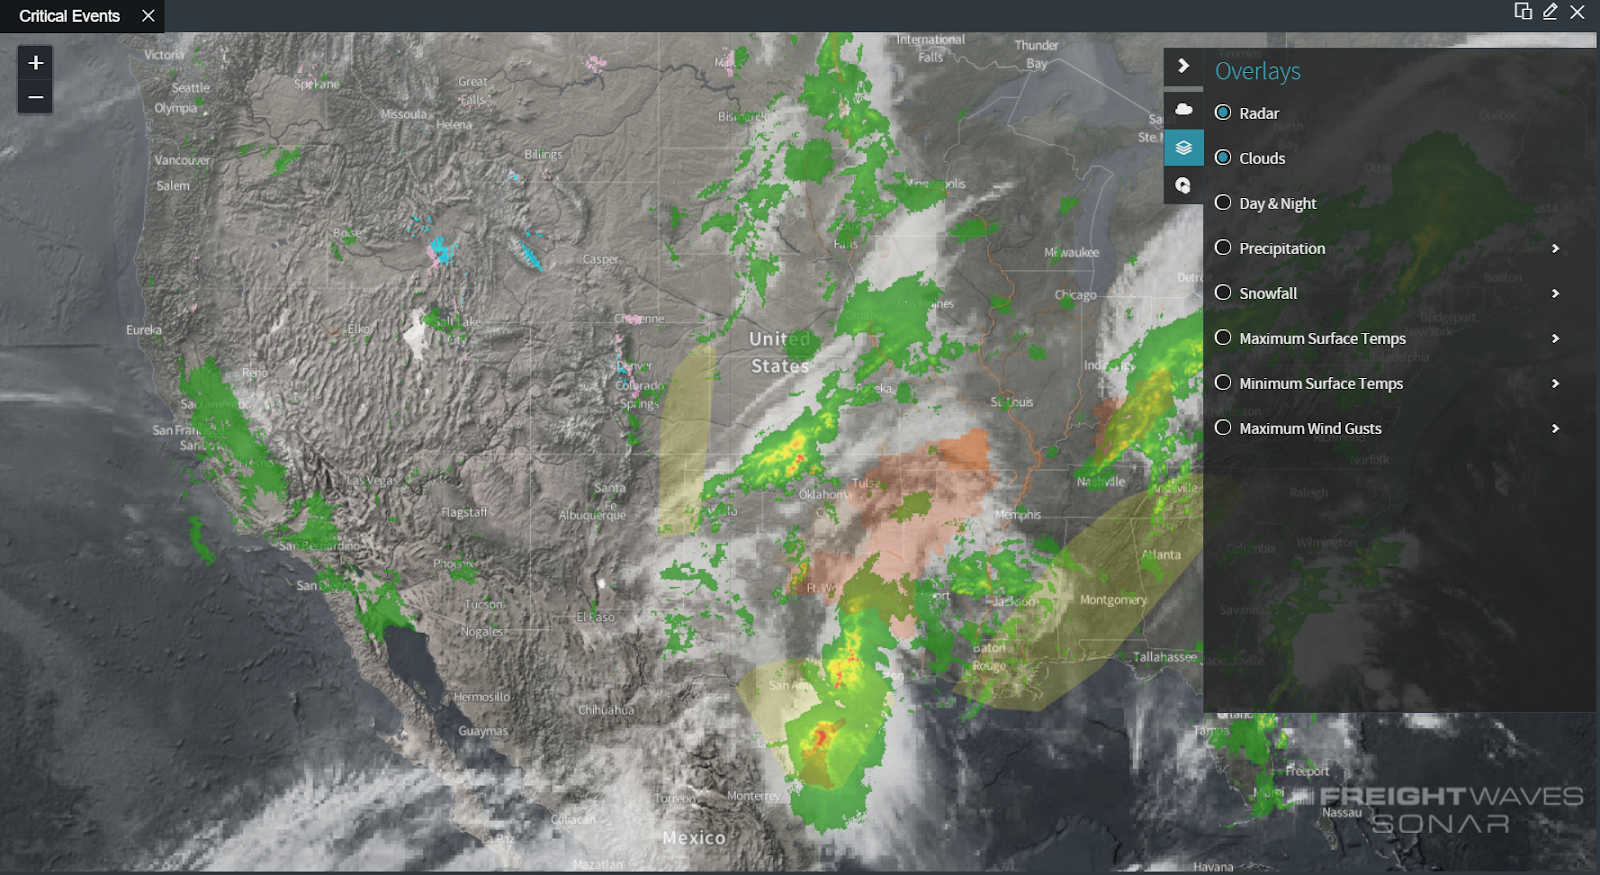
Monitor specific threats related to weather, wildfires, and earthquakes. See active severe weather watches and warnings.
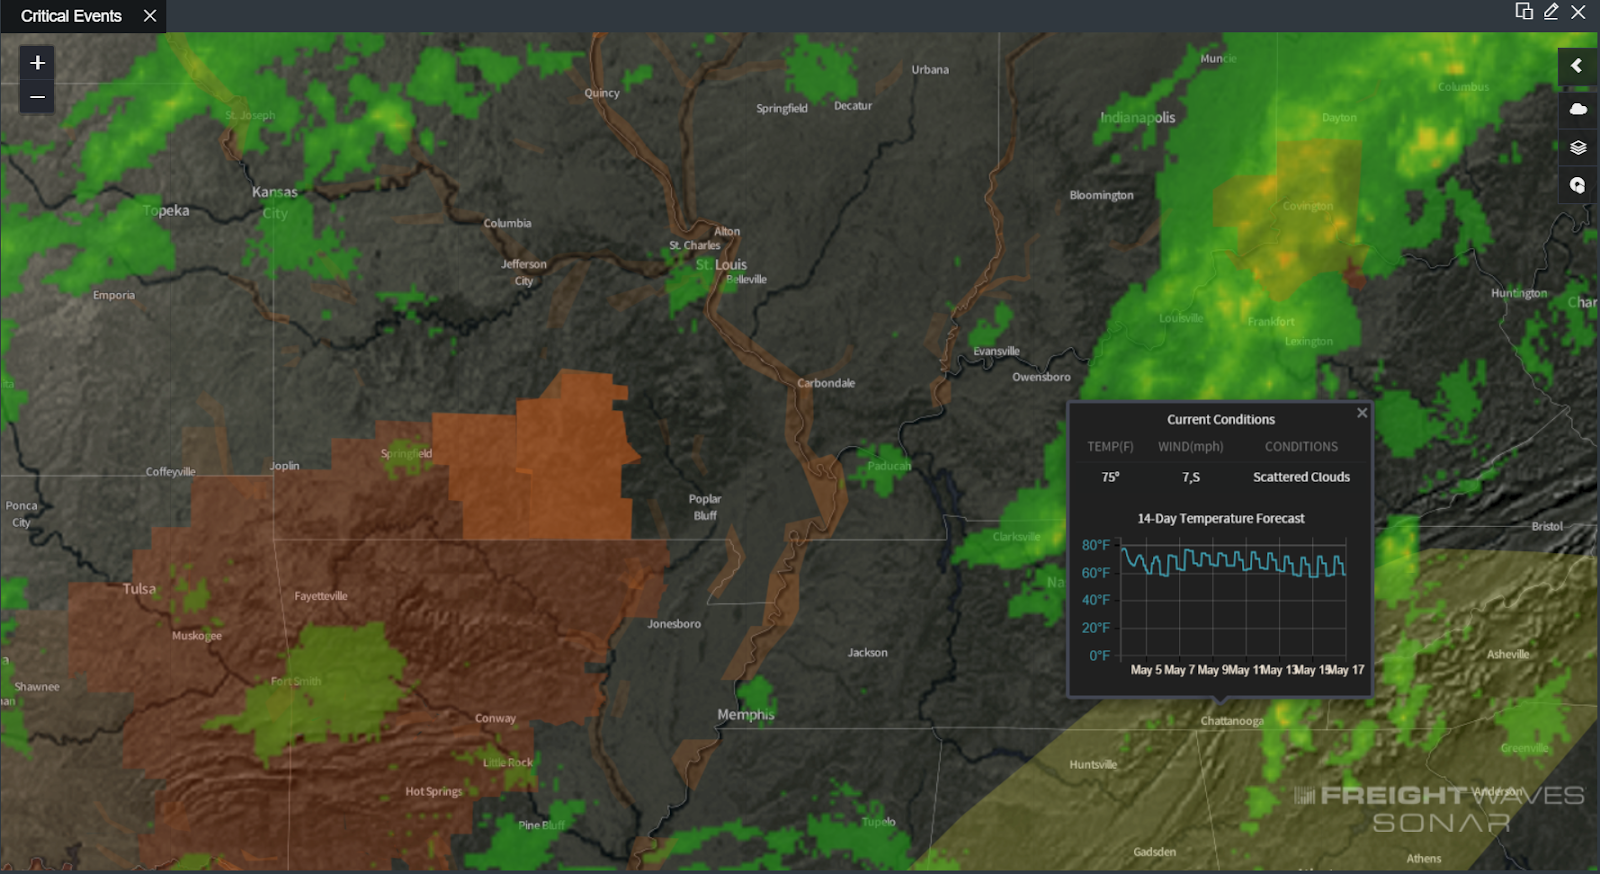
Get detailed current and forecasted conditions.
Calendar Widget
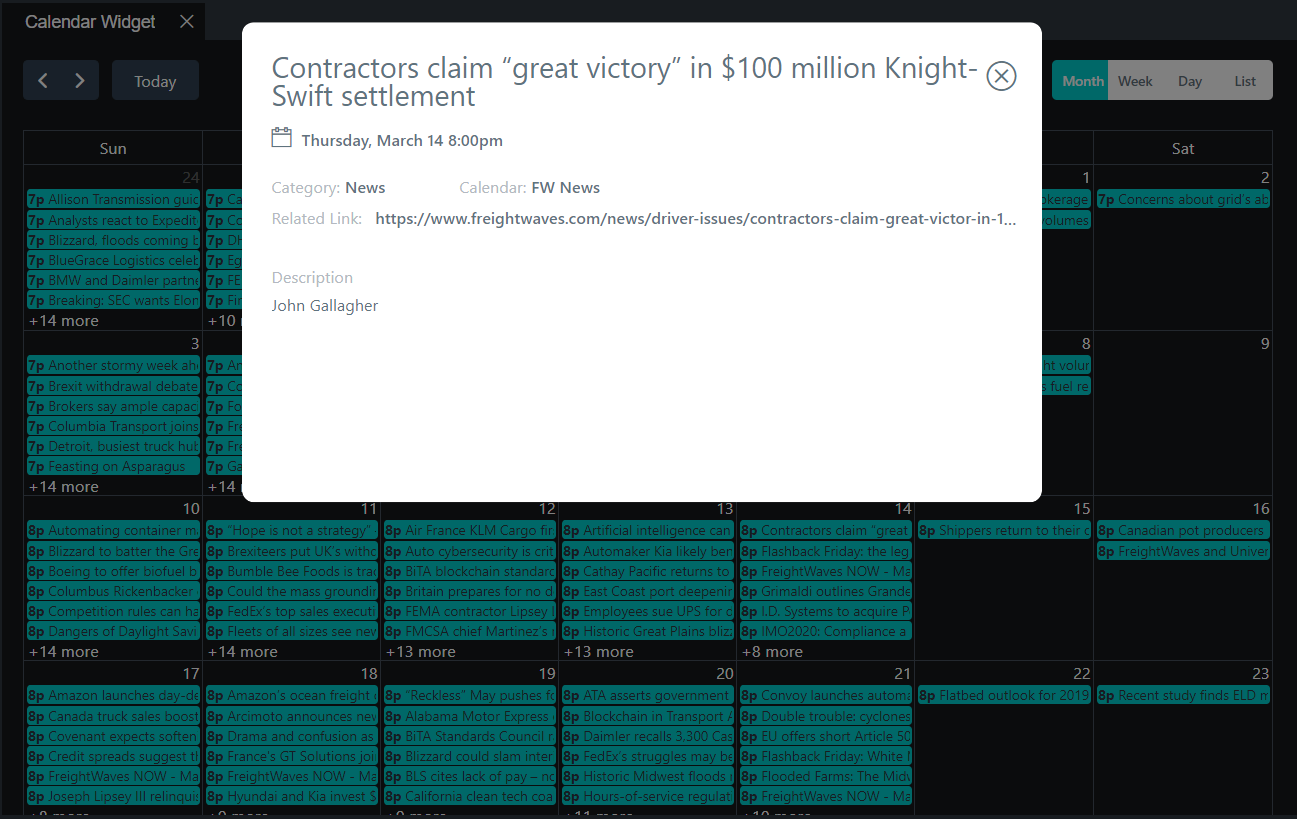
The calendar widget gives views of relevant FreightWaves news and holidays.
Video
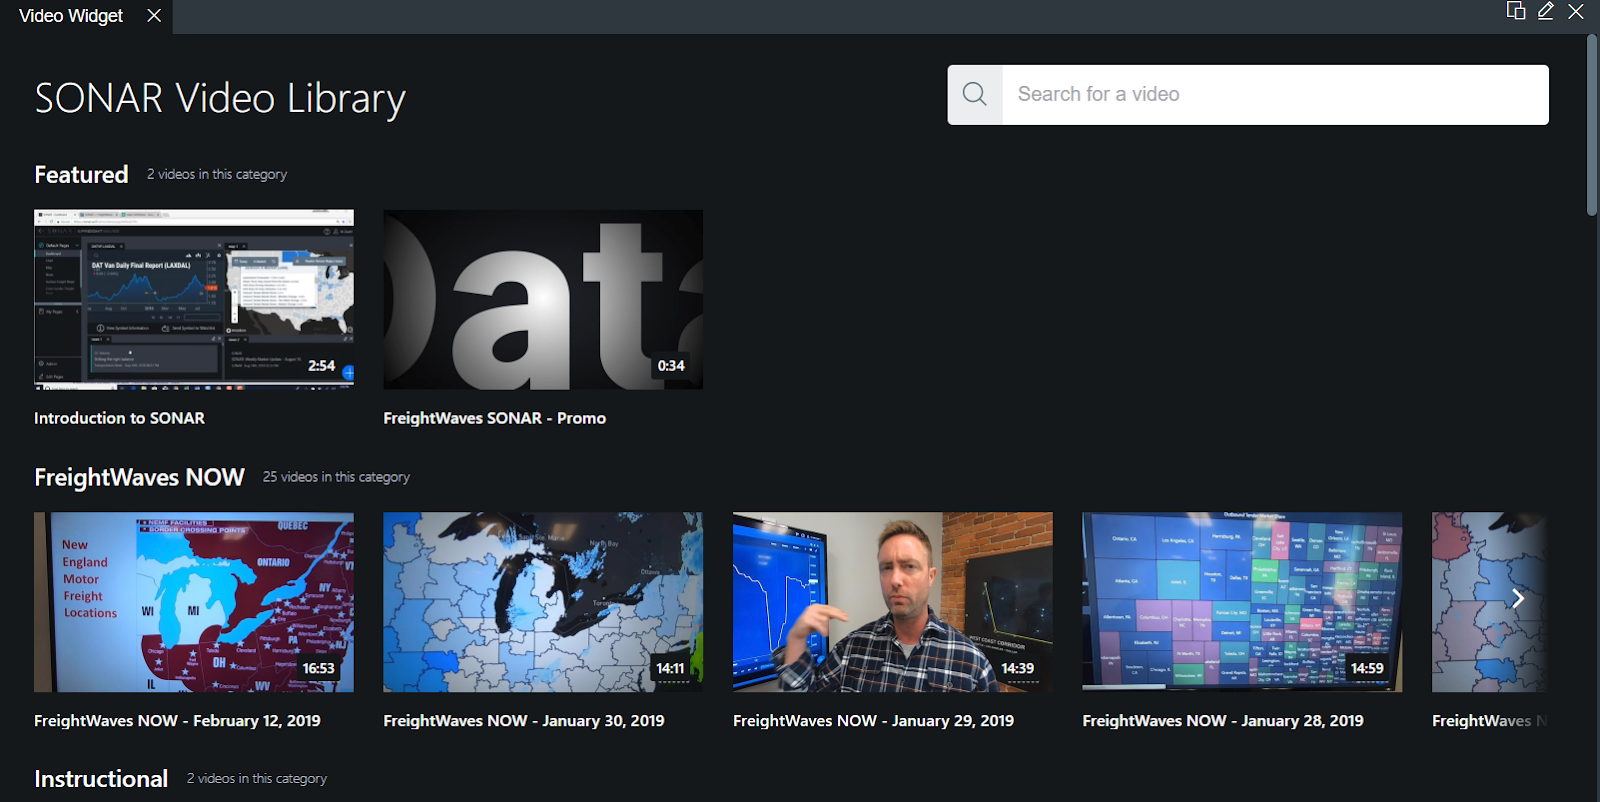
The video widget gives users the capability for streaming featured instructional video content on how to use SONAR, as well as exclusive SONAR subscriber only video content as well as all of FreightWaves public videos.
Rail Line Maps
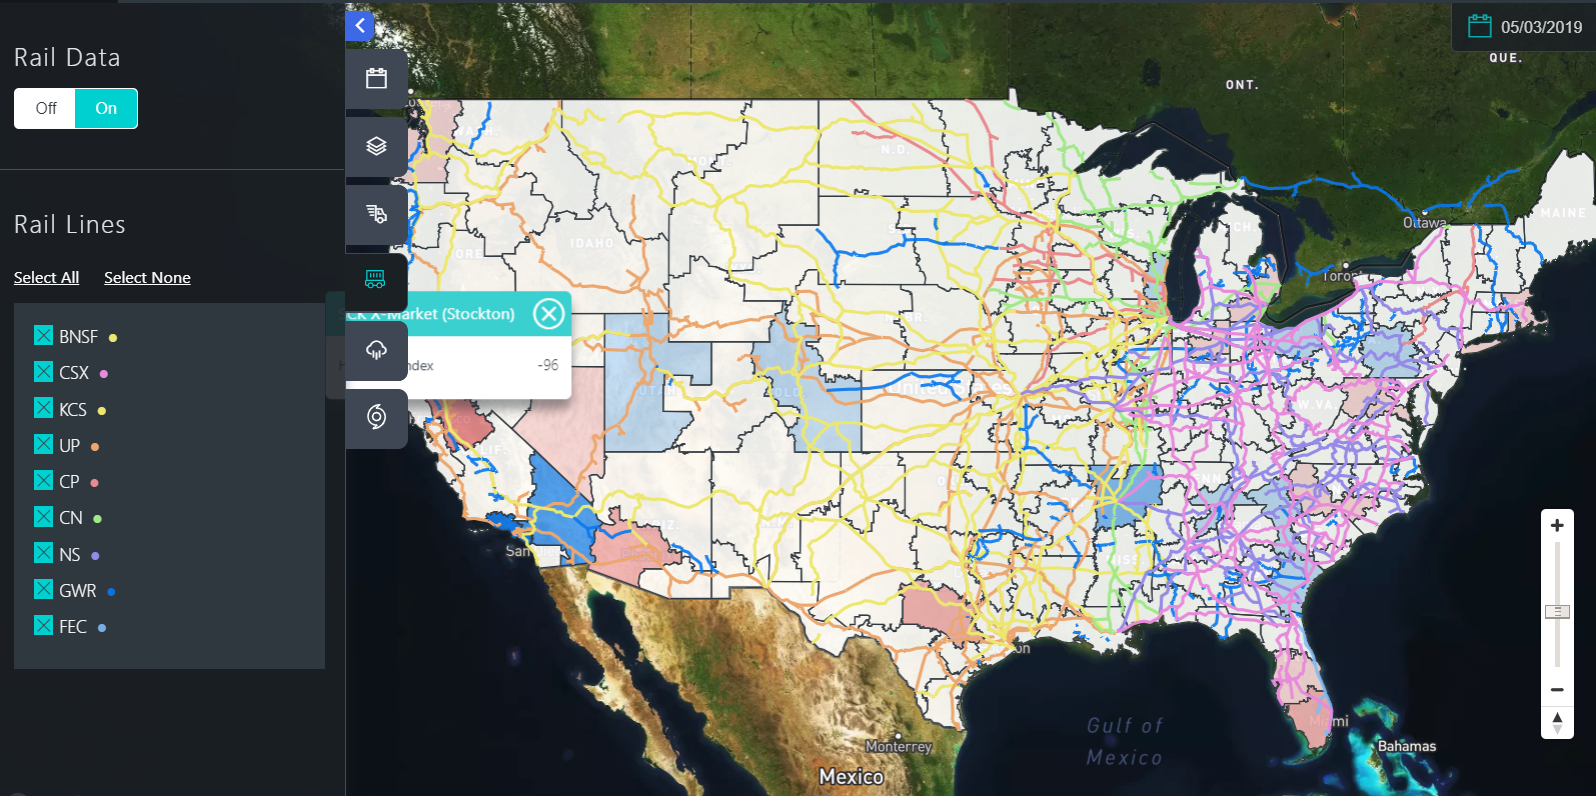
All major class 1 rail lines have been mapped and are available to toggle on and off the map widget as an overlay.
SONAR Analytics – Market Volatility Table
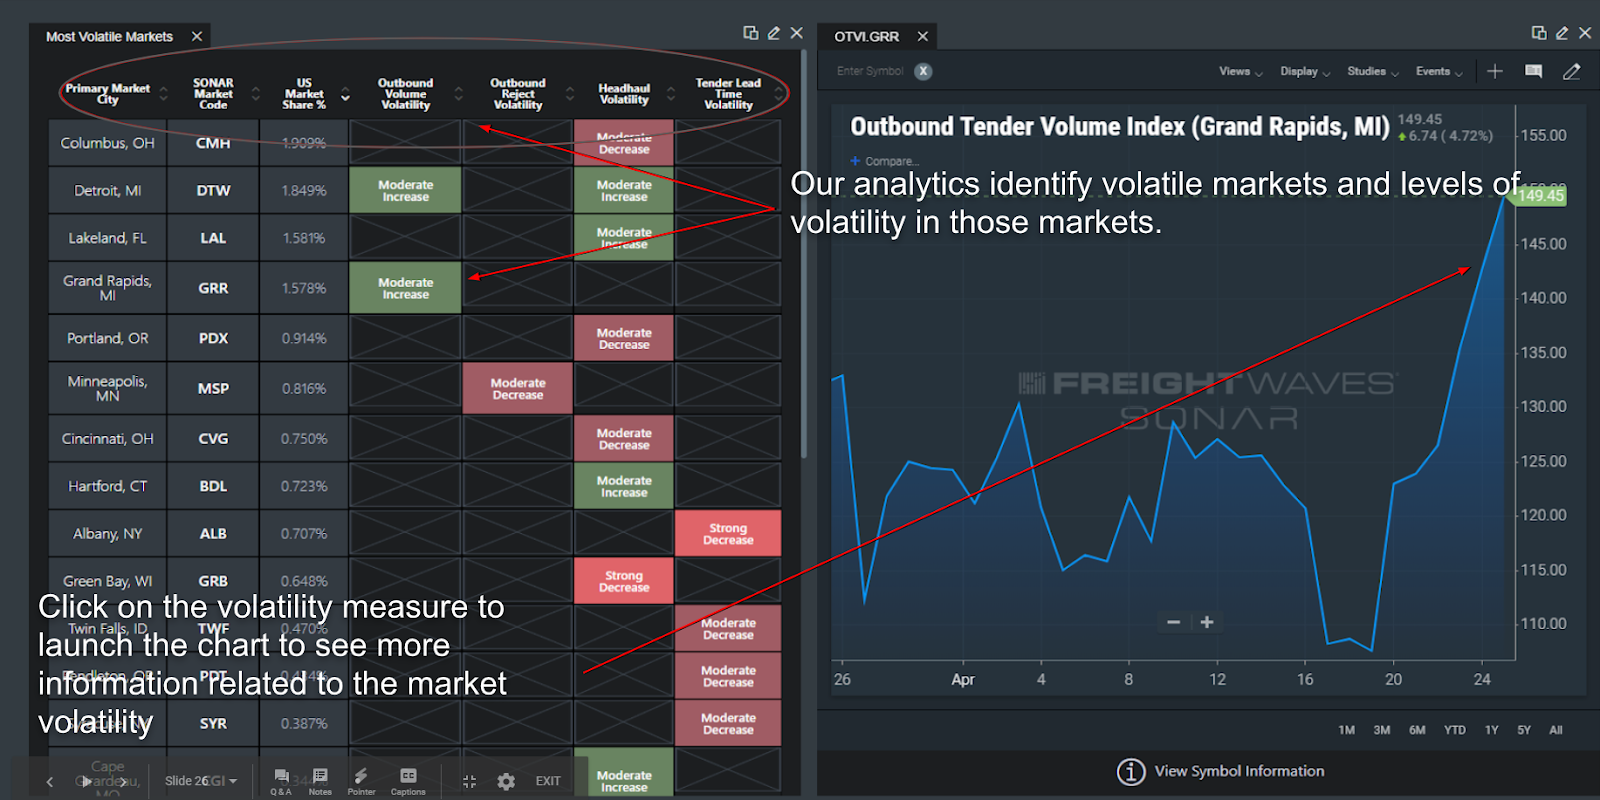
In order to provide users more options in sorting through the wide range of ever-expanding data FreightWaves has developed the SONAR Analytics widget with the market volatility table. The table will enable users to quickly identify where they need to focus their attention in the freight market by identifying the markets where the largest anomalies in Outbound Volumes, Rejections, Headhaul values and lead times.
Moderated Chat
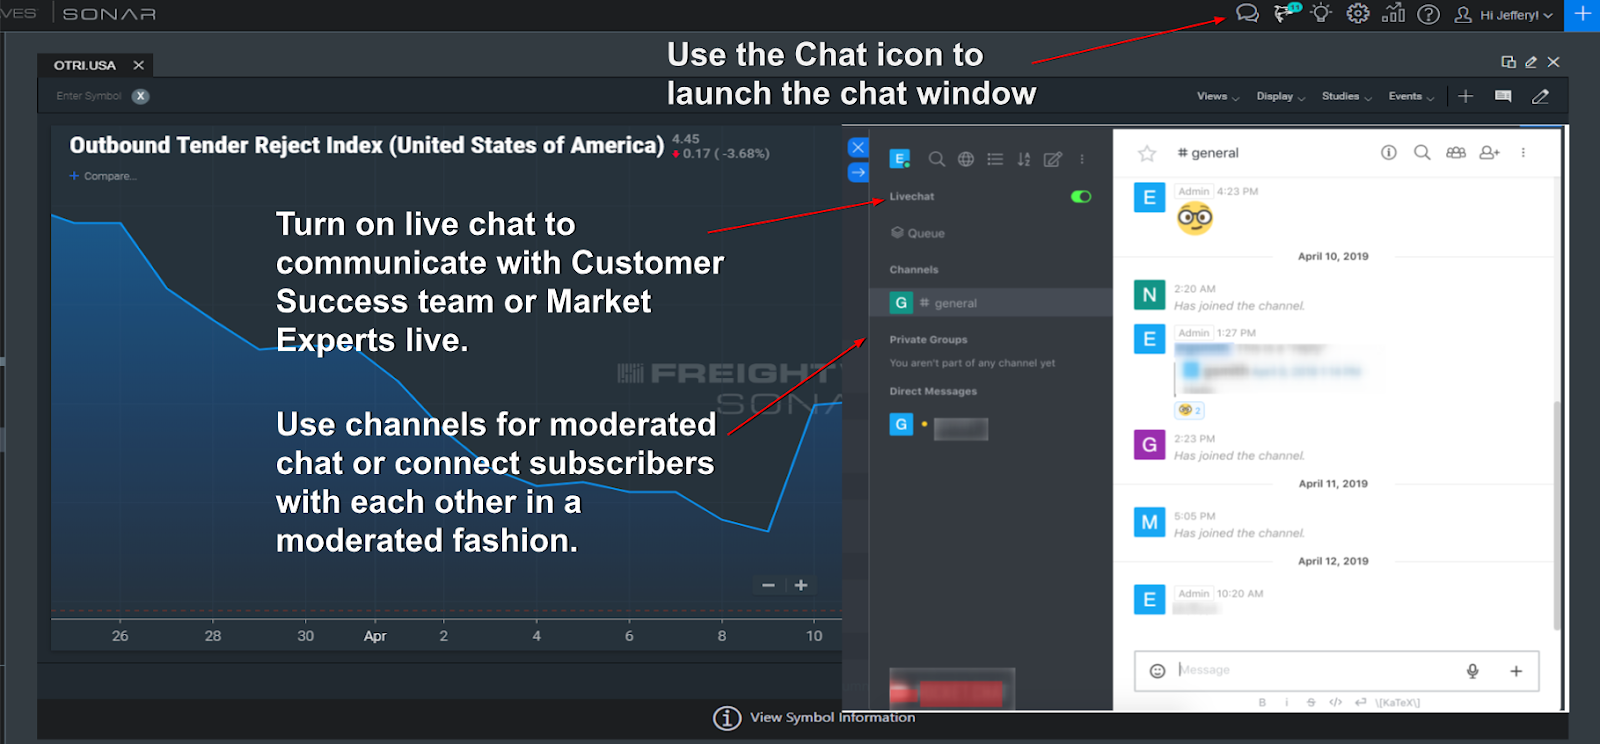
Users will now have access to a moderated chat feature where they can connect with FreightWaves market experts, customer success, and other SONAR users in an exclusive community for SONAR subscribers only.
Market Insights and Research
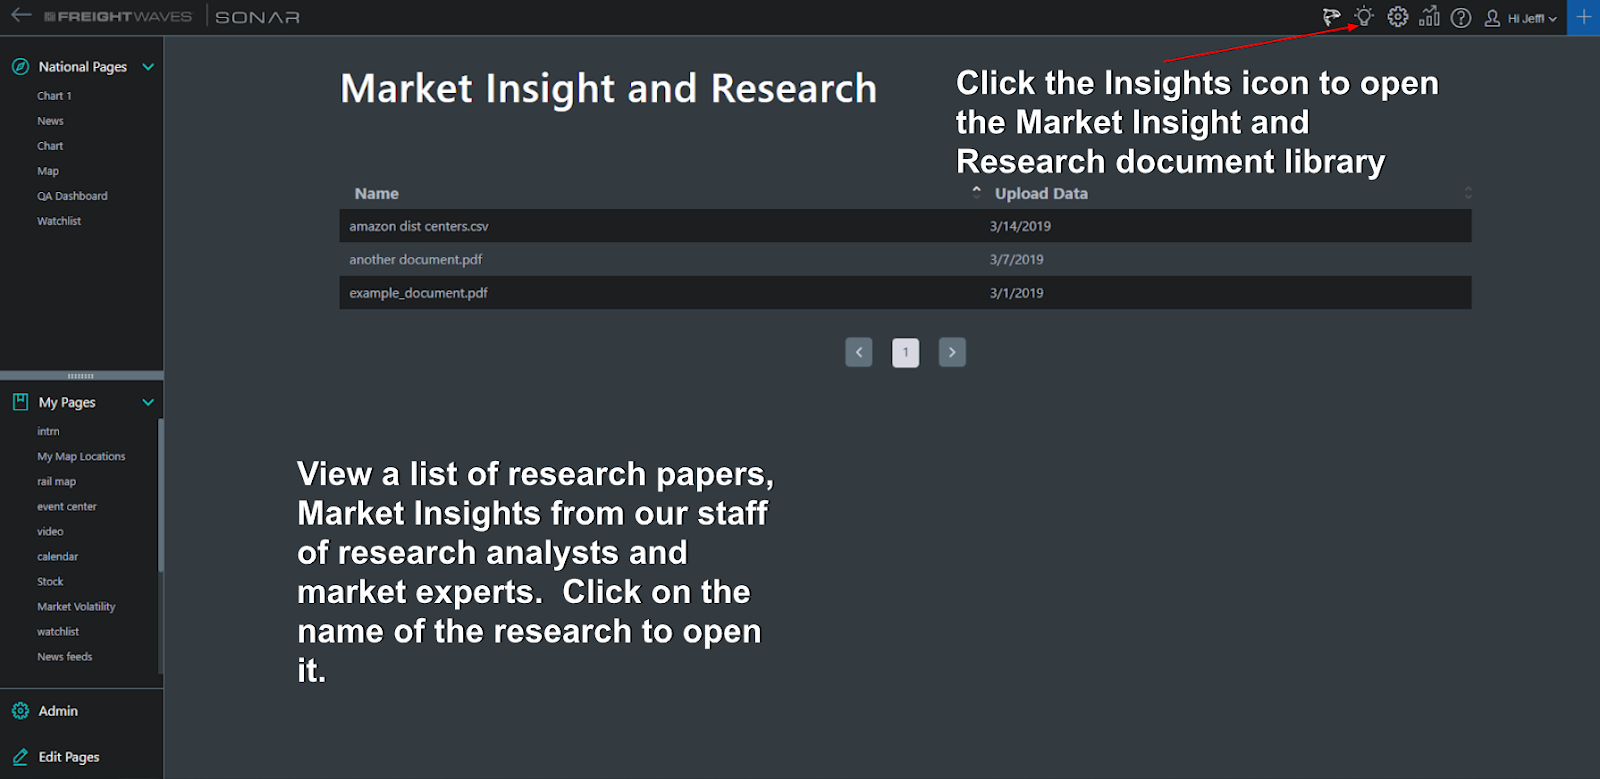
There will be a library of SONAR exclusive research available for users to gain insights into various market conditions. This includes research and surveys performed by FreightWaves research team and market experts as well as targeted papers where deeper dives into common transportation, oil, and economic situations are explored in more detail.
Customer specific indices and map location upload
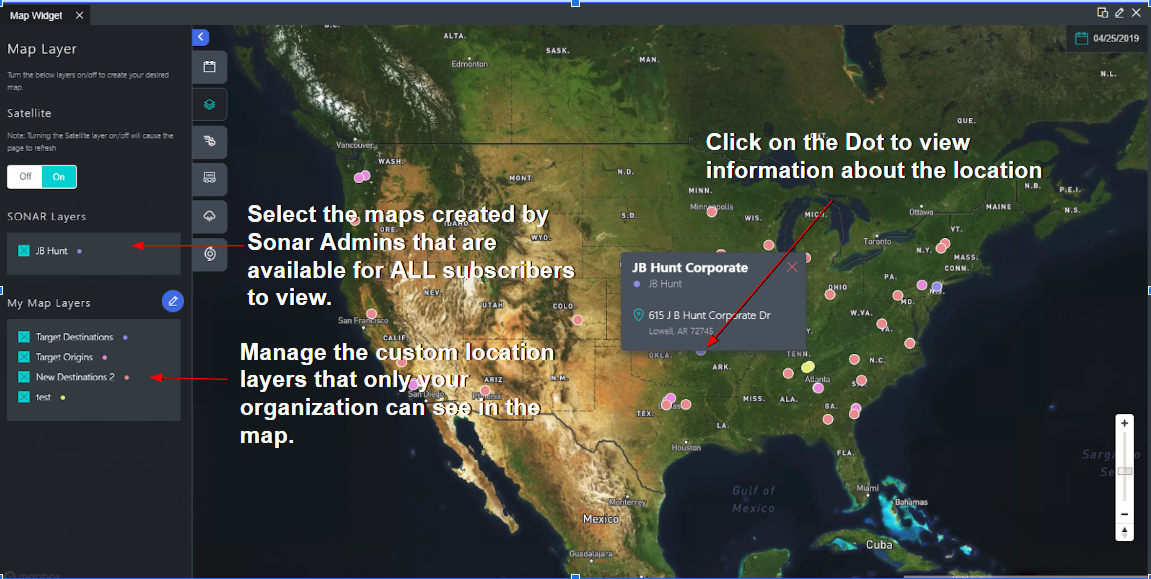
Users will be able to upload their own data in the prescribed format to SONAR so they can compare their performance to the rest of the market with tender rejection, volume, and lead time indices. They will also be able to upload specific locations to the map.
Digital momentum signals
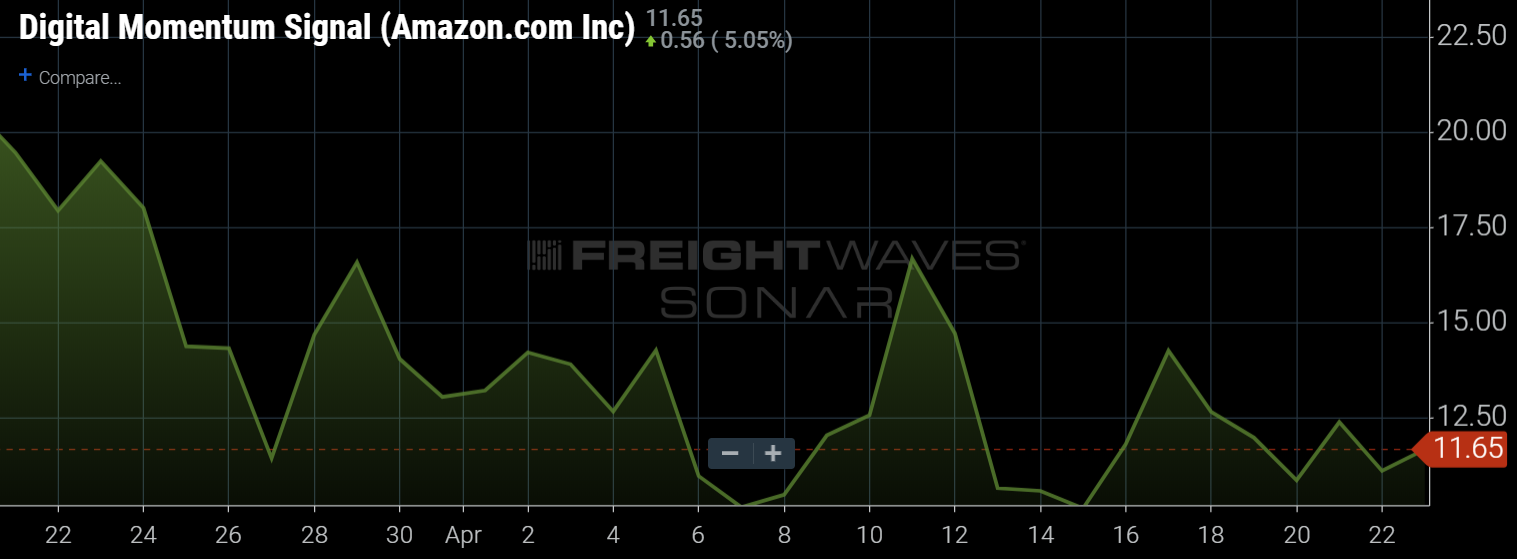
With most information being transmitted electronically over the internet and social media, FreightWaves now offers users digital momentum signals that can lead company or market impacting events. The more a topic or company gets mentioned the higher the value indicating increasing potential of a market altering event around that topic or company. Users will simply type SIGNAL to pull up a list of potential topics or companies offered. For publicly traded companies users can type SIGNAL. stock symbol to pull up the company’s signal.
Stock Prices
Stock prices for publicly traded companies are now available in SONAR. Users will type STOCK.(symbol) to pull up a chart of the company’s stock price.
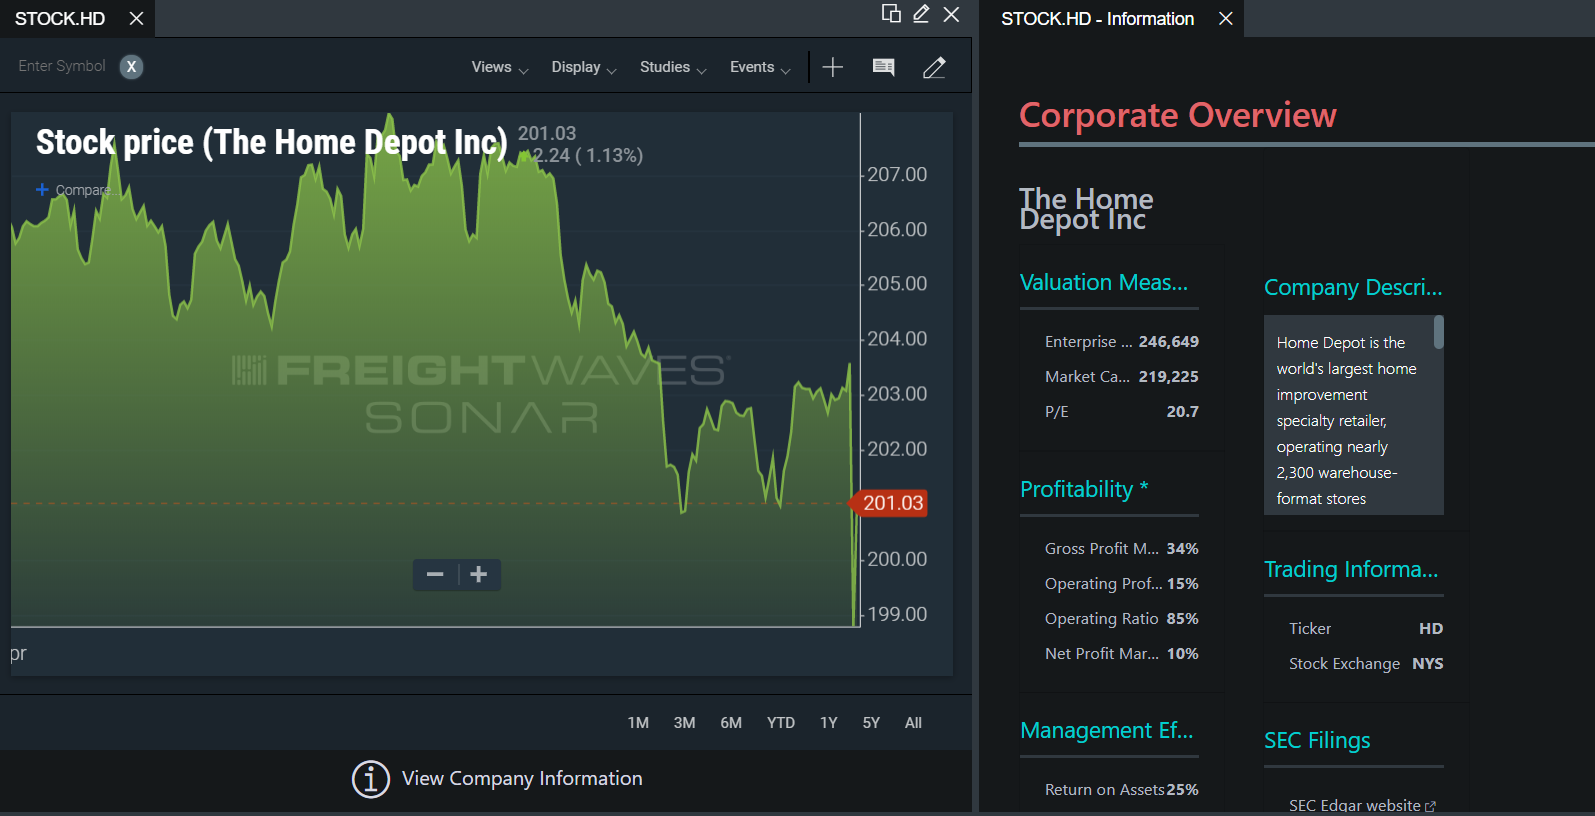
In addition to stock prices over 30 financial statistics including but not limited to the following have been added to SONAR for publicly traded companies:
- EBITDA
- P/E ratio
- Debt to Asset Ratio
- Net Income
- Market Cap
- Operating Margin
This info can also be brought up by clicking the “View Company Information” button at the bottom of a stock chart.