


FreightWaves’ SONAR chart of the week (July 14, 2019 – July 20, 2019)
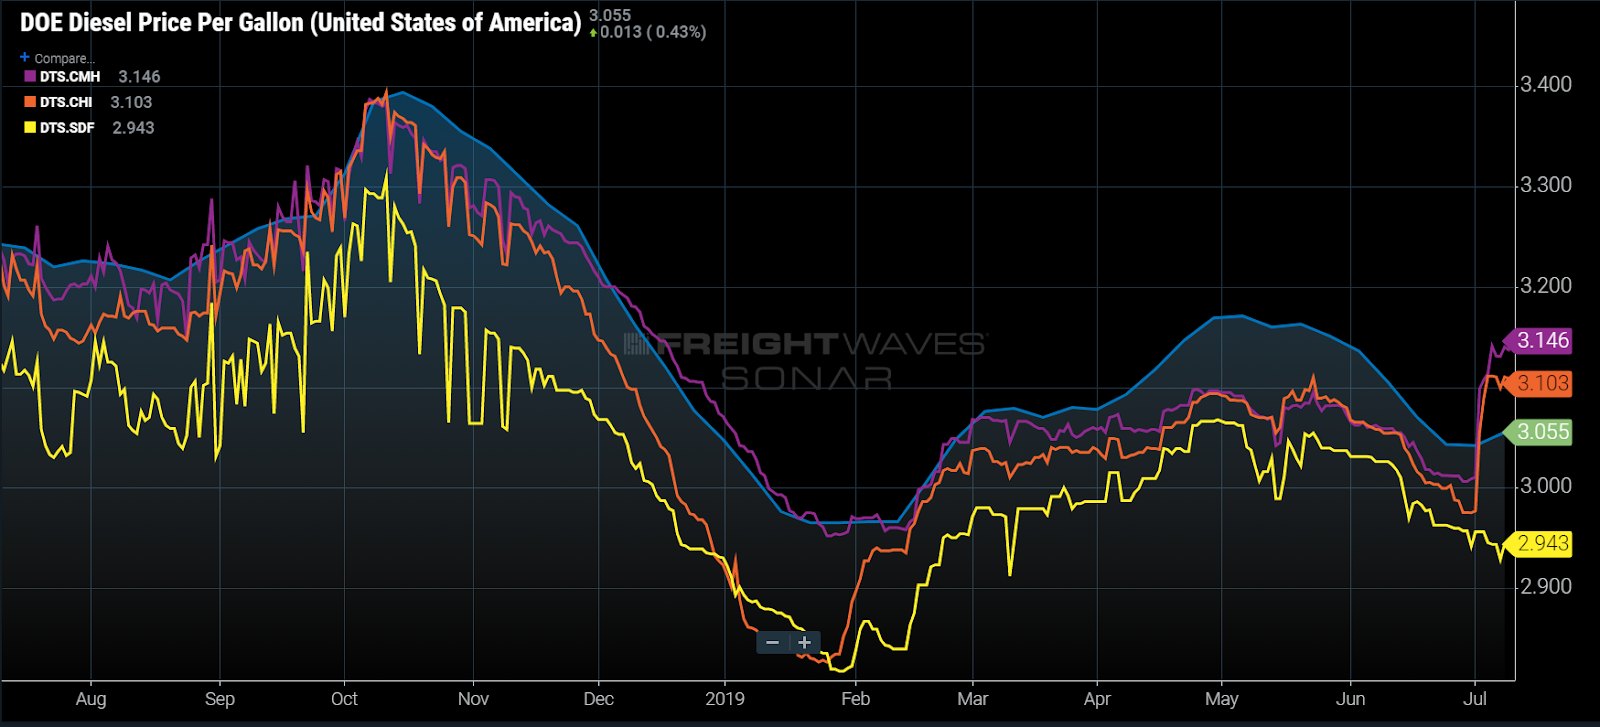
Chart of the Week: DOE Diesel weekly price per gallon – USA, Diesel Truck Stop average daily price per gallon – Columbus, Chicago, Louisville (SONAR: DOE.USA, DTS.CMH, DTS.CHI, DTS.SDF )
Twelve states increased their tax rates on diesel, the main fuel for the class 8 freight-hauling trucks, on July 1. The largest increases occurred in Ohio and Illinois where state tax rates jumped 19 and 24 cents per gallon respectively. The increases are quite significant in this region where there is heavy trucking density moving through the Illinois and Ohio corridors. These increases will hit smaller carriers harder than the larger carriers who have better fueling options outside of the area as well as better relationships/more leverage with fuel providers.
States tax fuel because they need funding for building and maintaining their transportation infrastructure. Other methods states use to collect funding include tolls, mileage taxes, and registration fees. As costs increase for materials and labor over time, so does the need for increased revenue. Most of these increases are not as severe as the ones seen in Illinois and Ohio this year, averaging around $0.01-$0.03/gallon. So why the large jump?
22 states have a variable rate gas and diesel tax, which means their rate adjusts each year based on certain criteria using measures such as the Consumer Price Index (CPI), construction costs, and gas prices. Ohio has a fixed rate diesel tax, which means the rate remains stable until a bill passes the state legislature to change it. This process is slow and years can pass before an increase is implemented. Once the bill gets introduced, costs have increased to the point where a large increase is needed.
In Illinois’ case, they are transitioning to a variable rate structure by taking a large leap in the first year then the variable rate will be based on CPI moving forward. The rate had not been changed since 1990.
These large jumps are difficult for small businesses such as owner operators and small fleet owners to manage as they now have to manage fueling differently. Many carriers pass along much of the cost of fuel through a fuel surcharge. This is normally a rate per mile based on the average price of diesel, which is released by the Department of Energy (DOE) every Monday. The average price is $3.055/gal this week in the U.S.
Looking at the average daily price per gallon in the Chicago and Columbus markets–two of the largest outbound markets in the U.S.–the average price per gallon increased from $0.04 to $0.08/gal below the national average to $0.05 to $0.09/gal higher.
The carriers fueling in these states are now forced to increase their rates, altering surcharge tables putting business at risk, or find an alternative fueling source to keep rates lower. The latter of these solutions being more difficult, since it involves negotiating new fuel purchasing deals, where small carriers have little leverage, or travelling outside the area to fuel in other states.
The average price for fuel in the Louisville market, which borders Illinois and Ohio shows a retail price $0.20/gal lower than Columbus, which means carriers travelling north and south along the I-75 corridor should fuel before entering Ohio or exiting Kentucky.
The problem with increasing rates is heavy competition putting downward pressure on pricing in a slowing freight market. Increasing rates just cents per gallon can make a difference on winning or losing loads, so it is not as simple as passing along the cost to the customers.
About Chart of the Week
The FreightWaves Chart of the Week is a chart selection from SONAR that provides an interesting data point to describe the state of the freight markets. A chart is chosen from thousands of potential charts on SONAR to help participants visualize the freight market in real-time. Each week a Market Expert will post a chart, along with commentary live on the front-page. After that, the Chart of the Week will be archived on FreightWaves.com for future reference.
SONAR aggregates data from hundreds of sources, presenting the data in charts and maps and providing commentary on what freight market experts want to know about the industry in real time.
The FreightWaves data-science and product teams are releasing new data sets each week and enhancing the client experience.
To find out more about SONARgo here or to setup a demo click here.
Logan Martin
Boy you really are stupid oh, you have no idea how fuel taxes work in the commercial trucking industry do you?
Dave Reid
Nancy is correct, Zach – your article is highly flawed and really makes you look pretty silly as an industry commentator. I suggest you read up on how IFTA works, then update the article.
Nancy
The only way to avoid the fuel tax in those states is to not travel through them, since fuel tax is based on miles traveled in the state, and not on how much you fueled there (that is just used to true-up each quarter). So if a company wants to avoid the increase, they need to not travel in that state.
Charles Wilmoth
US pumped 12 mbd,that’s 12×7 =84 mb per week,if the US uses 6mb per week,that’s a surplus of 78 mb per week now 78 mb x $65 per barrel = $5.07 billion per week. That’s $20.28 Billion per month,why are they increasing the fuel tax and better yet,why is fuel remaining significantly higher in proportionality to other countries.Where is the Surplus money going,the Money is made off of the 6mb per week!That means fuel s/b less than .20 cents per gallon