


Is the seasonality of freight changing?
Although I had no real appreciation for it, and actually hated much of it at the time, my first job out of undergrad gave me a detailed understanding of, and deep appreciation for, the transportation industry. From the most basic ground level up, it provided valuable lessons that would serve me well in a future, and the foundation for a career, that more than 30 years later, I could have never imagined. I sat on the side of a manufacturing plant floor in a cubical so small that I could fit several of them into my future spouse’s walk-in closet. I audited hundreds of thousands of freight bills. I learned to know at a glance whether the rate was correct or needed to be checked, often by inserting a 5.25-inch floppy disk into my trusty Compaq 286 deskpro computer or by opening up my well-worn NMFC guide. My background music was the hum of conveyor belts and fork lifts racing back and forth from the end of the manufacturing line to open dock doors with trailers waiting. My detailed reports, created in Lotus 123, were printed off on a dot matrix printer that I shared with the outbound freight traffic manager.
Most of the things I learned are still true today. I learned that while we really had no need for reefer trailers most of the year, during the coldest weeks of January and February we could use them to keep our liquid products from freezing. Consolidating large LTL shipments into multi-stop TL shipments are one of the simplest and quickest ways to bring down your costs and help you be the positive variance in the monthly budget meeting.
Some of the things I dreamed about have come to pass. “EDI (electronic data interchange) just within in your own company” has gone from a pipe dream to a reality and has been expanded to include all the participants in the supply chain, sharing data easily through Al Gore’s invention.
Some of the things I learned have changed, or at least shifted a little. “January is always the worst truck freight month,” has become “February is always the worst truck freight month,” as the proliferation of gift cards has moved some of the retail volume from the 4th quarter (October, November, and December) to January. Shoppers using the gift cards they received over the holiday appear in the store or go on-line in January to redeem those cards. This trend is often understated or at least under-appreciated, since many retailers recognize the sale of a gift card, especially those with their brand name, as revenue from a sale. Although this makes some sense for cards that can only be redeemed via that retailer or e-tailer, the reported retail sale revenue amount suggests a different freight flow pattern than what actually happens.
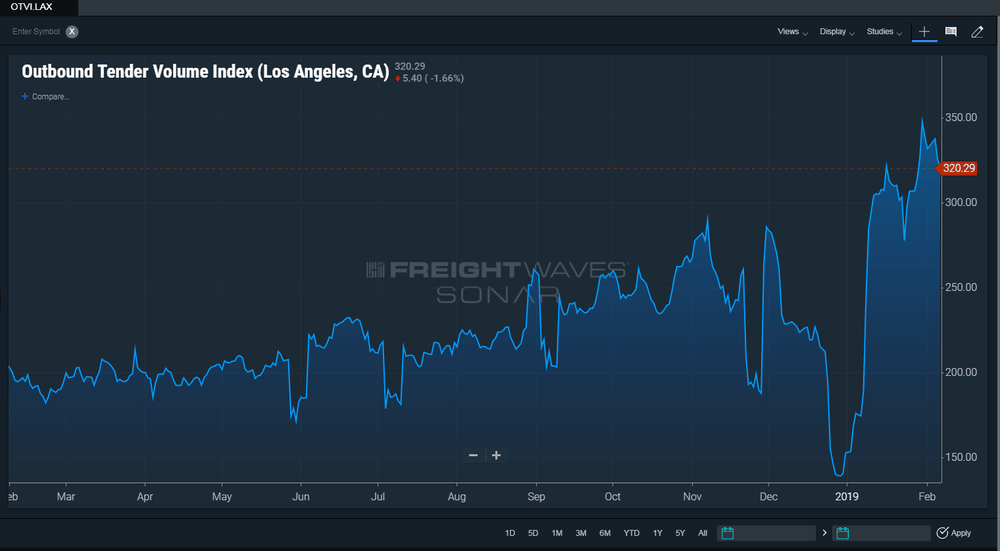
Gift cards offer a straightforward, logical explanation for the shift of the worst freight month from January to February, and this explanation is readily accepted as gospel by most in the industry. As the FreightWaves’ SONAR OVTI Index out of ONT and LAX (especially LAX) surge to levels above all those achieved last year, we also find it easy to point to retail restocking to satisfy gift card derived demand.
We would suggest that there is also a fairly compelling argument for less overall seasonality, or at least less volatility, that is attributable to seasonality as supply chain visibility (and the data that drives that visibility) becomes increasingly better, and available to an ever-larger population of marketplace participants.

As we zoom out to look at the U.S. Headhaul Index on as a SONAR heat map of where trucks are, and are not, needed, we can confirm that southern California is one of the best regions for trucks looking for loads. There is also a subtler message to be derived. Most of the regions are in-balance, or are relatively close to being in-balance (neither capacity or demand exceed each other by a wide margin).

Looking at the same map from mid-November highlights how out of balance many regions were at that time. Comparing these maps and looking at the OTVI out of key markets suggests that demand is stronger than is widely appreciated, and that much of the sanguine view about capacity held by shippers is driven by the balance of capacity, not reflective of a seasonal slowdown in demand.
Donald Broughton – chief market strategist
The smartest minds on Wall Street use charting analytics to quickly identify and then track trends in multiple data sets. Why? Because it works. Even the most intelligent investor or skilled trader identifies patterns in numbers when they are charted far faster than when those numbers are simply displayed in columns and rows. Graphically depicting data becomes more important when you are trying to compare two or more data sets and understand the relationship between them over time. When viewing a chart of a couple of data sets that are related, you begin to understand the reason of the marketplace. If you can add a series of technical indicators to the graph, you begin to understand the rhyme and the reason of the marketplace.
SONAR allows you to quickly view graphical series of data, many of which weren’t previously available to professionals trading the marketplace. More importantly, it allows you to view those data series compared to other data series (some proprietary, others not) and then apply the type of sophisticated technical indicators to the data series that are normally reserved for Wall Street. Patterns in the data don’t just sit there quietly as numbers; they literally jump off the screen at you. What are a few of those ‘jumping off the screen’ at us right now?
