


Most of the U.S. freight market has continued to stay relatively subdued, but southern California continues to show signs of limited capacity. Outbound tender rejection rates in the Los Angeles market continue to increase; up 338 bps since last week. The upward movement is made more significant in comparison to the rest of the U.S. as national tender rejection rates (OTRI.USA) have remained flat over the past 7 days, increasing only 24 bps.
Freight rates in early November are traditionally more volatile due to tighter service requirements and last-minute inventory replenishment – shippers need to get inventory into regional distribution centers and stores for holiday shopping. This year has proven similar in terms of long-run seasonality with its summer peak and subsequent decline, but is quite different to 2017 in terms of short run volatility – rates moving up and down 15-20% in a day.
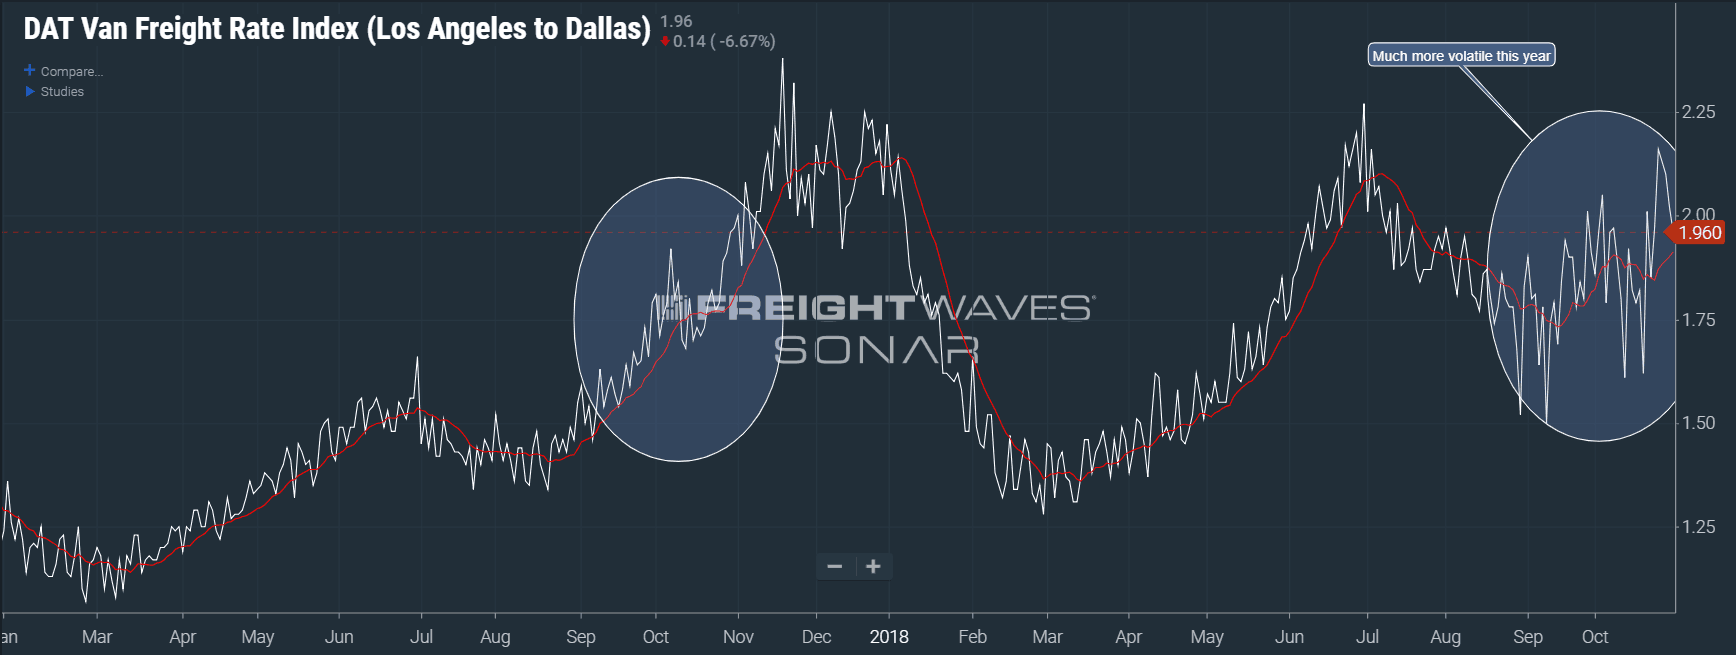
The DAT Freight Rate Index value for the Los Angeles to Dallas lane (DATVF.LAXDAL) on October 30, 2017 was $1.96. The value remains the same a year later. The DAT Freight Rate Index measures the average rate per mile with no fuel in the transactional (spot) freight market.
Even though the rate is the same YoY, the chart looks quite different. In the months of September and October last year, the 14-day moving average rose smoothly before plateauing in mid-October and then increasing again by the end of the month. This year, the moving average line has been much more jagged as rate volatility has increased significantly.
Volatility is a sign of an uncertain market. The buyers (shippers) and sellers (carriers) in the freight marketplace are in a constant state of cat and mouse as they rely on previous years’ information to predict when the market will turn. The past 18 months have been anything but predictable, and shippers and carriers are struggling to discern how much capacity and volume are in the market.
Volume dropped significantly at the start of October, but recovered halfway in the middle of the month where it has since leveled out, sitting approximately 3% below March 1st volumes. The national Outbound Tender Volume Index (OTVI.USA) dropped 1% this past week after jumping up briefly to previous value of 9,825. The big turn in market volume that many carriers are expecting has not yet occurred.
In other parts of the country, a few Midwestern cities have hit the radar in terms of showing early signs of destabilization. Minneapolis OTRI has increased 600 bps since mid-October. Indianapolis’ OTRI has jumped 200 bps in the past week. Indianapolis represents 2.34% of the total outbound truckload market while Minneapolis is .81%. Indianapolis has a greater impact on the broader market so it will be worth watching over the next few days.
We will be watching the larger major markets of Dallas, Chicago, and Atlanta over the next week to see if any of the southern California activity impacts the rest of the country