


Freight volumes declined for the second straight day to the lowest level since early April. The outbound tender volume index (OTVI) dropped to 9,739, its lowest non-holiday induced value since April 5th when it hit 9,499. The OTVI is an index that measures volume relative to the starting period of March 1st, 2018 and has a base value of 10,000. The 9,739 indicates volumes are roughly 1.61% lower than March 1st. September daily volume averaged approximately 1.5% higher than August.
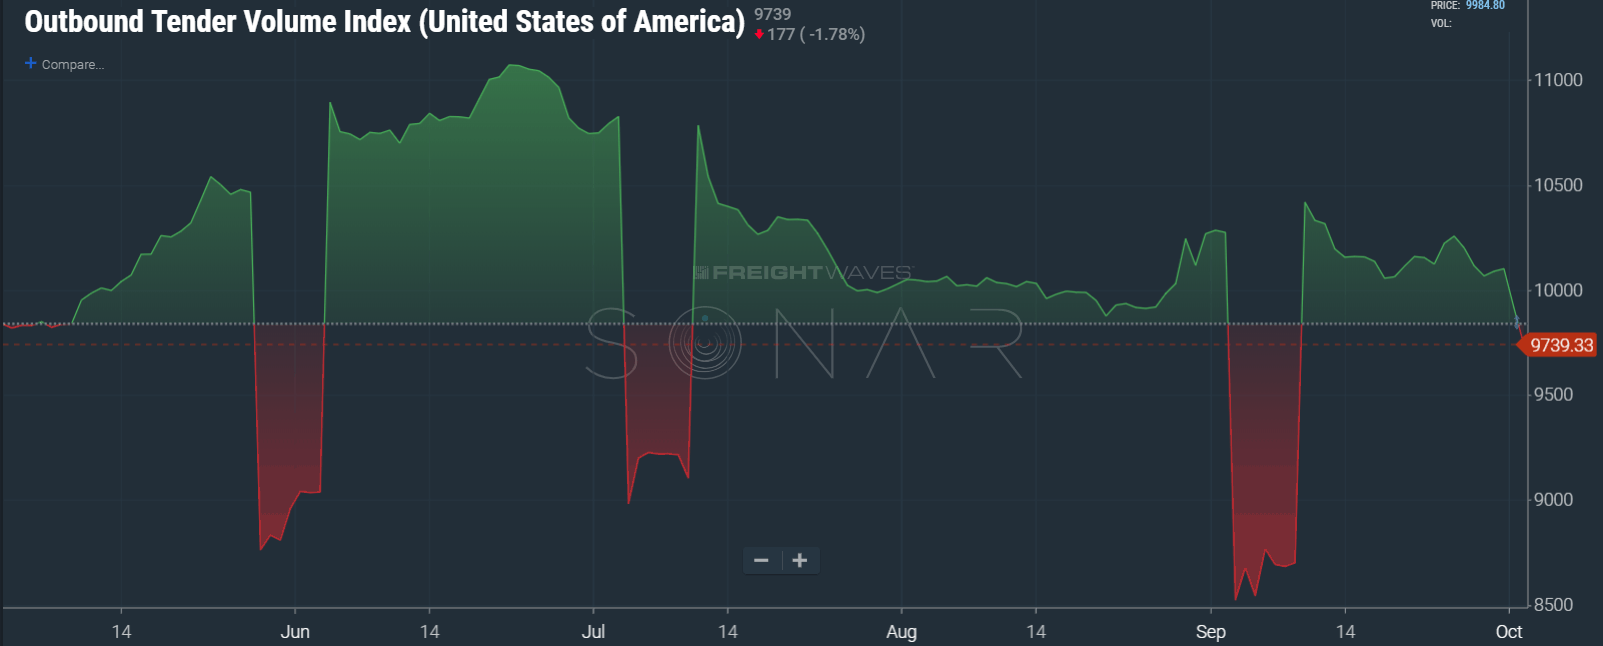
Falling volume in October is not an unusual pattern. Looking at the Cass Freight Index for shipments, an index based on invoice volumes for all freight, the last 4 of 5 years has volume flat to down sequentially off September. The lone year volume increased was 2016, which was a down year for freight and a slower year for the economy. The silver lining is the fact that in most “good” years October is down sequentially from September. It should also be noted 2018 volume is averaging 11% higher than 2017 through August.
With less volume comes lower tender rejections, as the national tender rejection index (TRI) fell 1.26 percentage points to 17 over the last 7 days. Decreasing volume means increasing capacity in most situations. Capacity needs to be available in the right areas for this to work. Currently that appears to be the case on the national level.
The volume drop has not been occurring long enough to effect spot market rates, two days does not a trend make, but it is worth noting as we enter a slower time of year for freight. Even though general volume decreases, there is typically a big surge of retail freight that occurs in early to mid-November due to the holidays creating pockets of imbalance throughout the country that lead to increases in spot rates.
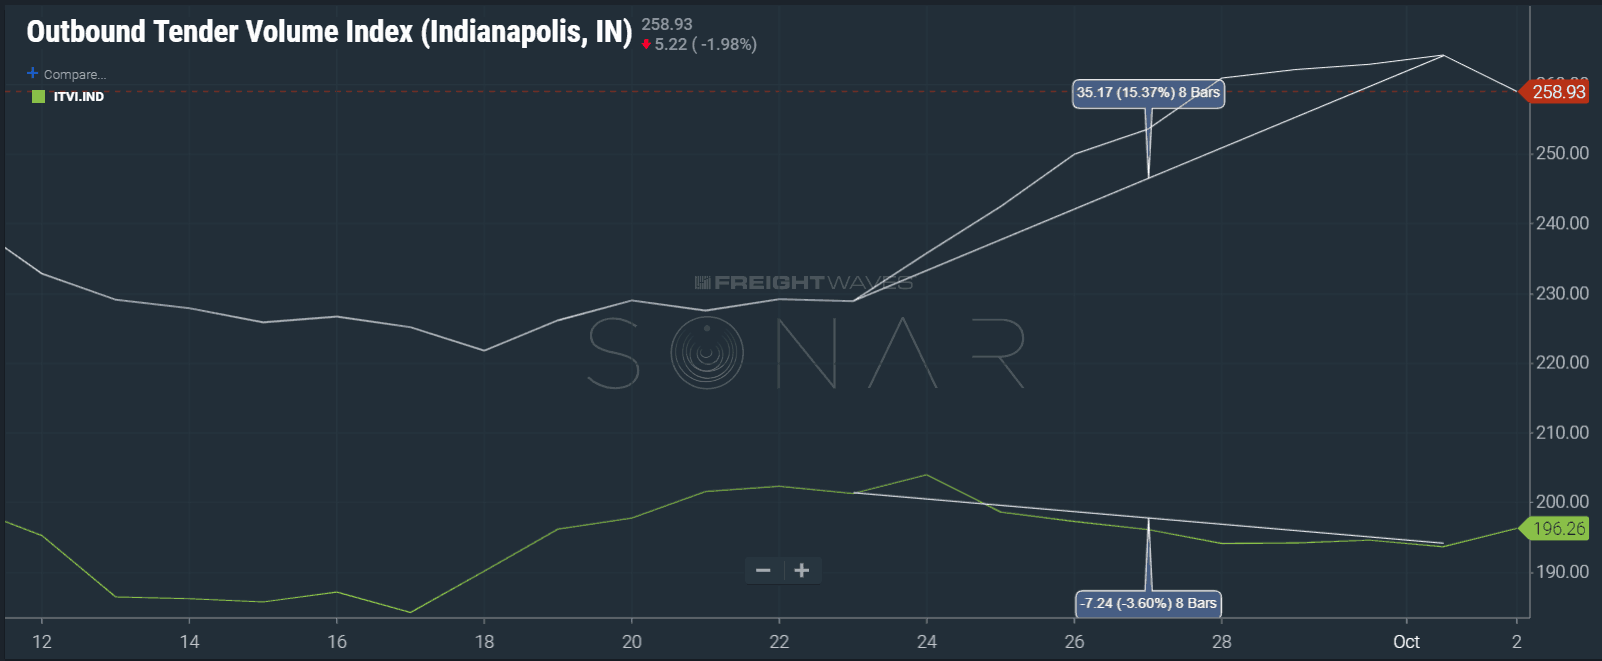
In terms of markets behaving badly, the Indianapolis market has destabilized over the past 7 days with a 21% increase or 400 basis point move in OTRI. This comes on the heels of seeing outbound volume increase 15% while inbound volume decreased 3.6% over the same time. Shippers in the market should be wary of capacity being lower than it has been. Whenever outbound volume outpaces inbound, a market has an increased risk of a capacity shortage. Indianapolis has experienced this kind of shortage previously as a short burst of volume disrupted the market in August as inbound volume was low. Some of this appears to be related to reefer demand as the reefer tender rejection index (RTRI) has increased roughly 1100 basis points since early September.
A market that appears to be on the brink of capacity problems is Los Angeles. L.A.’s Headhaul Index value (HAUL) has increased 83% over the past 25 days. HAUL measures the difference between outbound volume and inbound volume. An increase in value signals increased risk for lowered capacity. The L.A. market averaged roughly 2.03% of the total freight market through July, is now accounting for 2.65% of the total market share.
