


Additional Lanes
SONAR users now have access to over 3,000 more lanes for the tender rejection indices (OTRI/ITRI). As we obtain more data (and get better at analyzing it), we can provide additional detail on certain indices. This means that users will have access to information on 200% more lanes than they had previously. The obvious use here is now users will be able to target markets and freight activity more effectively.
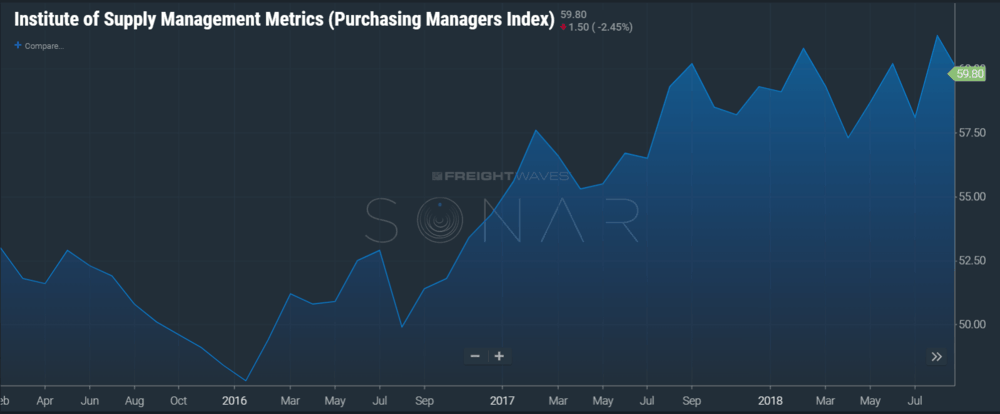
Institute for Supply Management (ISM) Indices
The ISM is a U.S. based non-profit organization that specializes in researching measures related to “supply management”. The ISM defines supply management as:
“the identification, analysis, determination, procurement, and fulfillment of the goods and services an organization needs to meet short- and long-term objectives.”
In layman’s terms, it is basically everything involved in making a product and distributing it. Transportation is a major factor. We now have 22 monthly indices that effectively measure production levels, pricing, employment, and orders to name a few main categories. The ISM has been around for over a hundred years and is highly regarded as one of the most reliable sources of information on macro-economic trends. The Purchasing Managers Index ™ is their primary measure of the general economy and like the rest of their indices a value above 50 indicates growth while a value below indicates shrinking.
To access ISM data in SONAR you enter ISM. one of the qualifiers below i.e. ISM.PMI:
Qualifier
Description
PMI – Purchasing Managers Index
MNEW – Manufacturing New Orders Index
MPRO – Manufacturing Production Index
MEMP – Manufacturing Employment Index
MDEL – Manufacturing Supplier Deliveries Index
MINV – Manufacturing Inventories Index
MCIN – Manufacturing Customers’ Inventory Index
MPRI – Manufacturing Prices Index
MLOG – Manufacturing Backlog of Orders Index
MEXP – Manufacturing New Export Orders Index
MIMP – Manufacturing Imports Index
NMI – Non-Manufacturing Index
NBUS – Non-Manufacturing Business Activity Index
NNEW – Non-Manufacturing New Orders Index
NEMP – Non-Manufacturing Employment Index
NDEL – Non-Manufacturing Supplier Deliveries Index
NINV – Non-Manufacturing Inventories Index
NPRI – Non-Manufacturing Prices Index
NLOG – Non-Manufacturing Backlog of Orders Index
NEXP – Non-Manufacturing New Export Orders Index
NIMP – Non-Manufacturing Imports Index
NINS – Non-Manufacturing Inventory Sentiment Index
Ultra-Low Sulfur Diesel (ULSD)
ULSD rack price (ULSDR) and volume (ULSDV) has been added as a daily value to SONAR. The price is represented in dollars per gallon while volume is represented at the rack level in gallons. ULSD is the primary fuel source for class 8 trucks in the U.S. The rack price is the rate that retailers and wholesalers pay for diesel. It does not include taxes (the majority of the retail cost), transportation cost from the refinery, and retail markup. It only includes the cost of the fuel itself and markup for the refinery.
An example would be ULSDR.THL for rack price in the Tallahassee, Florida market and ULSDV.THL for the rack volume.

ULSDR will give the user an idea of how much cost differential there is between the wholesale and retain price in a given area. ULSDV is an indicator of how many trucks are in a market over time. Many retailers will purchase fuel in anticipation for fuel price increases as well. A surge in ULSDV can indicate a n increase in fuel price is coming. ULSDR and ULSDV are available in the tri-delta granularities of weekly, bi-weekly, and monthly changes. All of these values will be available on the map for ease of identifying the most volatile markets.
