


Watchlist
Users are now able to track changes with SONAR data in the watchlist, whereas before there were no values under the “Change” and “% Change” columns for the proprietary SONAR data sets such as OTRI and OTVI. In addition, to make viewing easier, we added a “heat map” style feature so that users can easily see significant changes in their data points of interest to the list. A positive value is represented with shades of green and negative values are represented in shades of red. Neutral values will be represented in blue-ish grey.
To add a watchlist you create a page like any other via the “Edit Pages” tab at the bottom left of your screen. Then you click on the blue + symbol on the bottom right to bring up a list of widget options. Select the eye symbol labelled watchlist to start the process of creating the watchlist. In no particular order, you will then be prompted to:
1) Name your list
2) Select symbols by either directly typing or selecting from the dropdown list of newly added categories.
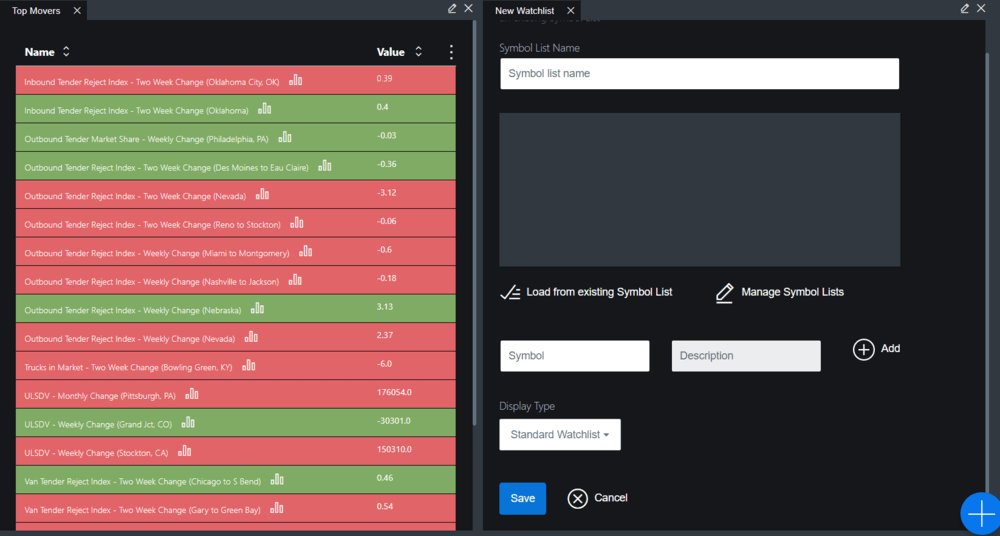
3) Selecting your display type of “standard” or “heat map” style of list.
There is also the option to load from existing symbol lists that will have generated lists produced by algorithms such as “Top Movers”, that pulls a list of the day’s biggest increases or decreases in terms of percentage change. There will be more lists added to this over time.
Search Bar Categories

SONAR now has improved search bar capabilities with the addition of index and granularity categories. Users can now search for tickers that are most relevant to them with a list that is designed to be a high-level description of how the index can be used for analyzing the markets. The granularity categories are organized by geography and various index specific segments. The full description of indices and granularities can be found here.
In addition to these new features along with minor bug fixes, you will also notice there have been a few minor aesthetic changes and some structures that will be utilized in future product enhancements.
