


This is an introductory-level market view. Please don’t try to figure out all of the details without getting some experienced logistics and railway cost analysis help.
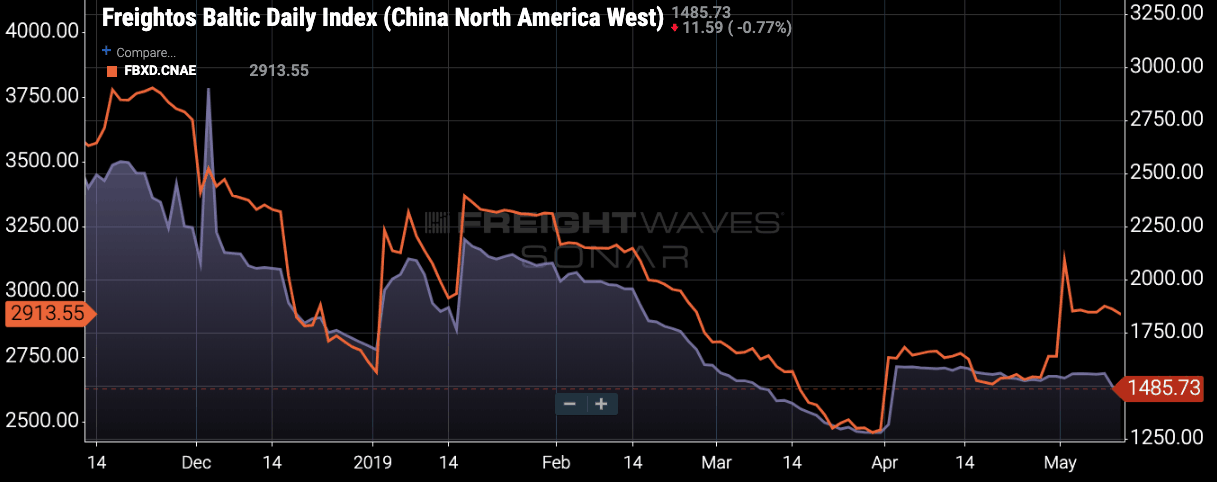
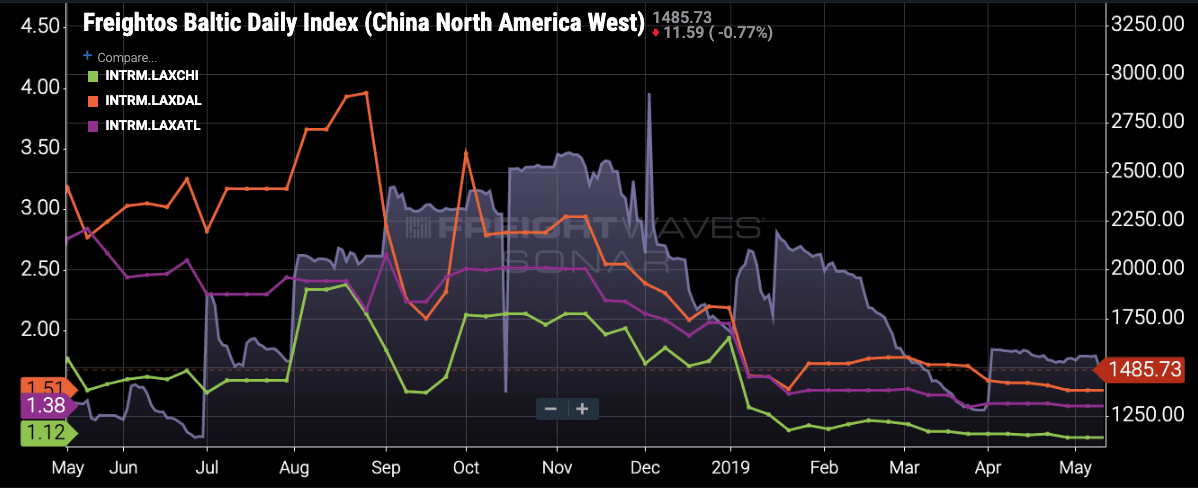
From a simple two-variable SONAR graph (below) comes Digital Age insight on the likely double-stacked container train East/West rail rates. The graph below combines FreightWaves’ sourced data from the global Freightos Baltic Daily Index maritime data files. These Freightos files are part of the tool kit used by logisticians and maritime carriers in market demand and market supply analytics.
Those individuals are specially educated. This short market view isn’t a substitute for that kind of professional background.
Nevertheless, the graphic gives an interesting economic picture beyond just maritime commerce. It visually tells us more than just what the China-Panama Canal-USA East Coast rate differences are compared to China-Pacific-USA West Coast container rates.
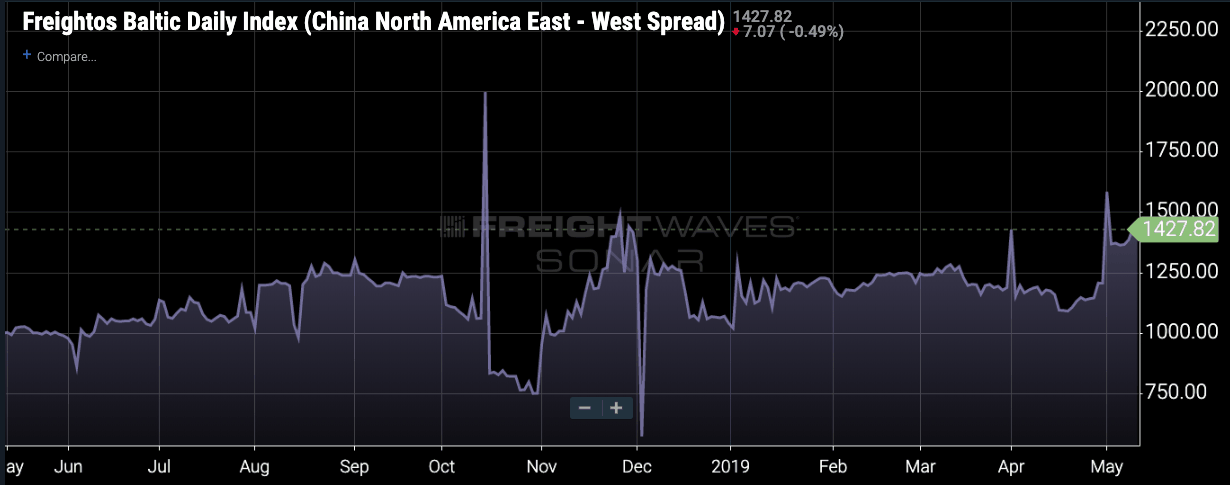
The variable timeline of the rate differences identifies approximately $1,000 to $1,400 landed port rate paid by shippers.
Yes, there are exceptions. Some shippers with exceptional volumes get lower rates. And the timing of a vessel’s sailing can and does impact the spot market price levels.
Port efficiency stevedoring costs also vary by port city. Vessel congestion and drayage delays are being ignored in this graph.
Yet, as an experienced rail and rail/maritime intermodal analyst, what I see is an interesting visual representation of possible geo-pricing leverage – particularly for the two major western railroad carriers – BNSF and Union Pacific.
A container originating in China and destined for Chicago, Memphis, Atlanta, Pittsburgh, New York City or the southeastern U.S. port areas that enters the U.S. at one of the Pacific ports could be transferred to an intermodal train and run eastward to those markets in less time than the Panama Canal ocean ship transit time. Time savings vary, but typically are six to eight days shorter via a West Coast transfer to stack intermodal trains.
Faster arrival of inventory to Midwestern or Eastern states has a daily/weekly calculation that depends on the commodity value, interest charges while in transit, and delay in the computed faster final selling time versus a Panama Canal route. That’s a tricky inventory math problem best left to experts. Simplistically, let’s assume $600 per container for a week’s delivery time advantage if the container cargo street value exceeds $1 million.
The “pricing leverage” for intermodal suggests about a $1,800 +/- “play.” That dollar value will vary significantly for different destination regions.
For intermodal to be the preferred route solution, the West Coast stevedore costs, stack train loading costs and possible transloading costs from a forty-foot equivalent unit (FEU) container to a higher cubic volume 53-foot domestic container must be factored in. There is more. There will be an interchange cost if two railroads are involved (for example, moving a railcar from a Union Pacific train to a Norfolk Southern train). Finally, let’s include the regional destination drayage and rail car unloading costs.
I used the word “costs.” Why? Because we are thinking as transport economists. The costs could be marginal costs, average long-term costs, or most likely profit mark-up costs. To the shippers these are quoted in the real world as “the price.”
A logistician’s decision on which mode and port option to use will compare the land intermodal pricing against the two Baltic price index values on the graph. That is not a simple task.
Lots of variables can change the comparisons. Less rainfall in the Panama uplands can increase the Canal transit costs (ship tariff paid).
Or here in the U.S., a port, a stevedore, a drayage driver, or one of the hook-and-haul rail hub-to-rail hub parties can independently and suddenly change their prices. Yes. This is part of the technical U.S. rail intermodal business model complexity.
The biggest cost is going to be the rail haul, because of the 2,000- to 3,000-mile distances. Port stevedoring and the possible drayage likely vie for the second tier of prices to be covered.
Conclusion
It is obvious that this one SONAR graph is not a dollar-for-dollar or party-by-party price comparison.
But if you are already a logistics party in this land-rail haul option versus the port-to-port all- water option “optimization,” this SONAR platform Baltic graph is an easy to use index tool to keep track of changes.
If you are a policy planner or a state DOT researcher, you also can use this index to observe competitive changes in near real-time.
SONAR analytics are leveling the knowledge playing field. No more need to spend hours or days in the library or on the computer searching dated sources. FreightWaves brings that referencing right to your desktop. You can even add your own base data. BRAVO!
Think of SONAR like Quicken, which makes it easier to understand tax and financial accounting – without a degree in those subjects.
What else about costing, pricing and freight mode market views will we see next? More railroad freight insight, I predict.
