


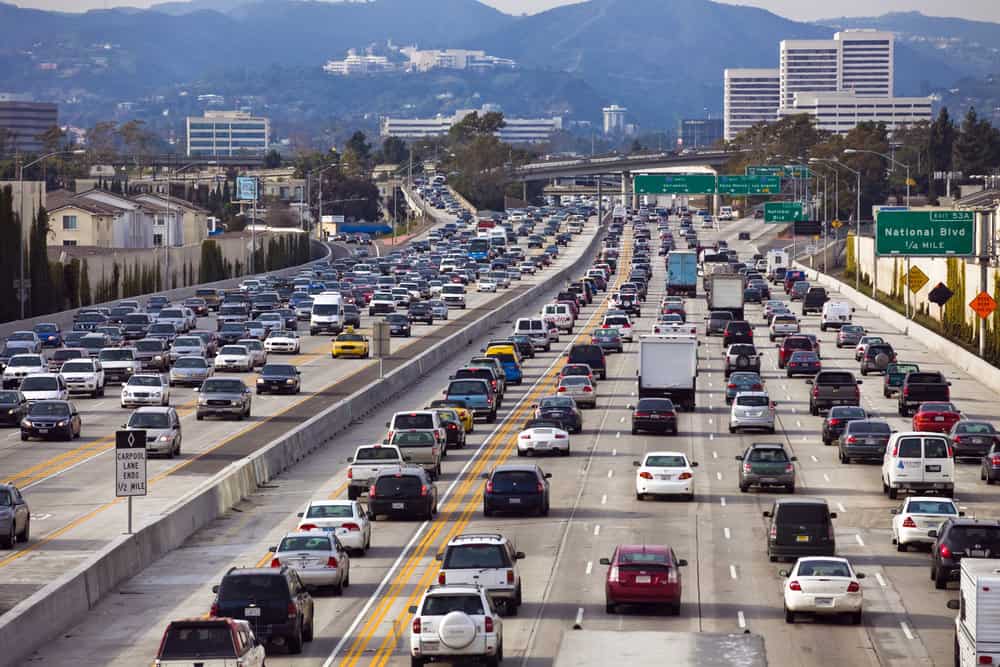
Earlier this year, FreightWaves analyzed the American Transportation Research Institute’s (ATRI) annual release of bottlenecks in 300 locations around the US. It showed an alarming rise in congestion nationwide. So, with the release of the Reason Foundation’s comprehensive report, examining the performance of State Highway Systems nationwide, we decided to dive in.
Reason Foundation’s Annual Highway Report has tracked the performance of the 50 state-owned highway systems from 1984 to 2015, using a variety of methodologies. This edition ranked the performance of state highway systems in 2015, with congestion data from 2016.
Each state’s overall rating is determined by rankings in 11 categories, including highway expenditures per mile, Interstate and rural primary road pavement conditions, bridge conditions, urbanized area congestion, fatality rates, and narrow rural arterial lanes.
Congratulations to overall winner North Dakota! Top prize is based on performance and cost-effectiveness, thanks to excellent scores on urban Interstate pavement condition (3rd overall), rural Interstate pavement condition (4th), urbanized area traffic congestion (4th), and maintenance disbursements per mile (3rd) — which, it turns out, is a major issue nationwide. Kansas, South Dakota, Nebraska and South Carolina were the other states in Top Five overall.
New Jersey wins Top Loser, ranking 50th in overall performance and cost-effectiveness due to having the worst urban traffic congestion and spending the most per mile — $2 million per mile of state-controlled highway, more than double what Florida, the next highest state, spends per mile. Rhode Island, Alaska, Hawaii and Connecticut are also in the Bottom Five overall.

FreightWaves spoke with Baruch Feigenbaum, Assistant Director of Transportation Policy at Reason Foundation, and lead author of the Annual Highway Report.
First, why is the data collected so much delayed?
“We use the US Federal Highway Administration’s (FHWA) data. We’ve tried to get them to speed up, and we’ve considered other data sources, and while we’ve reached out to others who might be able to provide us with more efficient information, we stick with this process so that it’s clear we’re being impartial,” says Feigenbaum.
What about the urban pavement condition part of the study? Are the numbers reflecting a significant downgrade?
“It does seem like a downgrade across the nation — at least slightly. There are four or five states that seem to be really struggling,” says Feigenbaum.
What about congestion?
“Well, we changed the way we measure data this year. We use INRIX data now,” says Feigenbaum.
INRIX provides wide coverage and accurate information by using advanced fusion technologies to integrate a full range of traffic data sources. It aggregates GPS probe data from a wide array of commercial vehicle fleets, connected cars and mobile apps.
“Based on this report I couldn’t say specifically. But we have seen a nationwide uptick in congestion since the end of the recession.”
Are there any other overall significant factors of any kind that jump out? Any given segment of the 11 different aspects you all looked at?
“There are four or five states that seem to be really struggling.”
“Fatality rates have gone up after years of going down. We don’t know why. It might be simply because more drivers are on the road,” responds Feigenbaum.
“Also, the amount of money being spent by states on various categories across the board is going up way above the rate of inflation. Like maintenance disbursements have gone up 34%.”
Other state stats
Nearly half of the states (23 of 50) made progress compared to the previous report. Two states, Iowa and Delaware, improved their overall rankings by double digits, while six states had overall rankings that worsened by 10 or more spots:
Iowa improved 25 positions, from 40th to 15th in the overall rankings, as the state’s per mile spending increased somewhat but mileage in poor condition (on urban and rural Interstates and rural arterials) improved considerably.
Delaware improved 18 spots, from 37th to 19th overall, as per mile spending decreased while mileage in poor condition (on urban Interstates and rural arterials) still improved.
Wisconsin fell 10 spots, from 28th to 38th, as per mile spending increased even as mileage in poor condition (on urban and rural Interstates) worsened.
West Virginia fell 11 spots, from 25th to 36th, as the condition of its bridges worsened, as did the condition of its rural Interstates and arterials.
New Mexico fell 13 spots, from 11th to 24th, as urban area congestion worsened and narrow rural arterial lane mileage increased.
Oklahoma fell 16 spots, from 17th to 33rd, as per mile spending increased even as mileage in poor condition (on urban and rural Interstates and rural arterials) worsened considerably.
Ohio fell 17 spots, from 9th to 26th, as per mile spending increased but the state’s road conditions worsened. Additionally, Ohio’s percentage of bridges in deficient condition jumped considerably as this year’s totals included functionally obsolete bridges, whereas in the last assessment, this information was not provided.
Maine fell 18 spots, from 5th to 23rd, as per mile spending increased even as the state’s road conditions (particularly urban Interstates) worsened.
Check out the complete report here.
Stay up-to-date with the latest commentary and insights on FreightTech and the impact to the markets by subscribing.
