


Roadcheck 2018 is now in full swing. Here at FreightWaves, we thought we’d examine the freight market data in SONAR—our SaaS platform that launched in beta on May 22nd—and see how inspections week is affecting the industry.
According to the Commercial Vehicle Safety Alliance, this year’s Roadcheck will focus on “hours-of-service compliance,” following the December 18, 2017 implementation of ELD regulations.
In reference to the 2017 Roadcheck, CVSA President Capt. Christopher Turner (Kansas Highway Patrol), reiterated the importance of hours-of-service violations, “Thirty-two percent of drivers who were placed out of service during last year’s three-day International Roadcheck were removed from our roadways due to violations related to hours-of-service regulations. It’s definitely an area we need to call attention to this year.”
We started by looking at our SONAR data for outbound and inbound tender rejection rates, particularly focusing on the market in Los Angeles. Not only is LA a huge market for inbound and outbound trade, California is also limited in terms of entrance and exit points, making it difficult for drivers to avoid inspection sites.
We hypothesized that outbound and inbound rejection rates for California would rise in the last week of May, as drivers aimed to avoid inspection. 2017’s International Roadcheck resulted in 3,809 trucks pulled from the road due to violations in the state of California alone, marking it as a hotspot for CVSA inspectors.
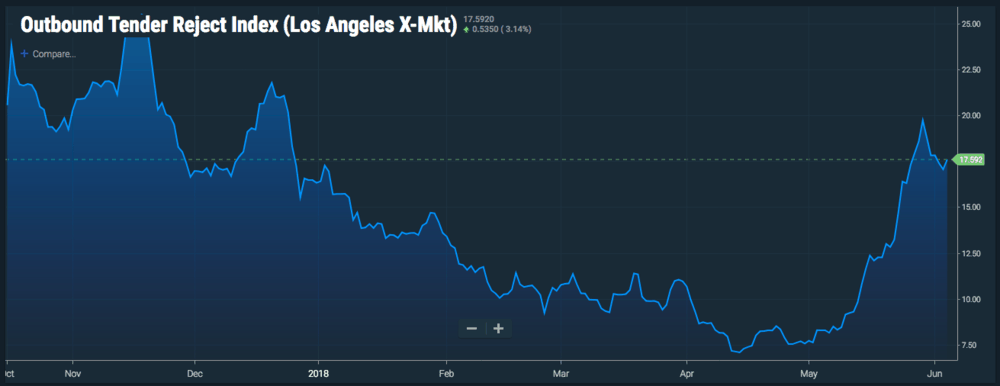
The outbound tender reject index (OTRI) measures loads leaving a market–no matter the destination—and their rejection rate by carriers. On May 29th, 2018, OTRI in Los Angeles jumped to 19.73, meaning that roughly 19.73% of loads were rejected by carriers. By June 5th, 2018, this rate dropped to 17.59, meaning that fewer carriers were rejecting loads out of California.
Inbound tender reject index (ITRI) measures loads coming into a market—no matter their source—and their rejection rate by carriers. Rates in Los Angeles also spiked on May 29th, 2018 from 20.45% rejection to 19.18% rejection, eventually settling back down at 17.94% as of June 5th, 2018.

These indicate that drivers tended to reject loads both in and out of Los Angeles—clearly pointing to something happening in the California market. Since the spike in rejects on Memorial Day, “OTRI has been falling considerably faster than ITRI (down roughly 11% vs. 6.2% in the same period), indicating people wanting to leave LA more than they want to enter,” according to Brad Hill, FreightWaves’ Senior Data Scientist.
“It coincides with the theory that Roadcheck shows up in our data. In the past, we have seen both OTRI and ITRI correct from spikes at roughly the same rate, so the fact that the difference in corrections is so stark should act as evidence that we are at least partially seeing the effects of Roadcheck in our data,” Hill concluded.
More to come as Roadcheck 2018 wraps up today.
