


Michael Rudolph
Friday, March 1, 2024
Beware the false spring
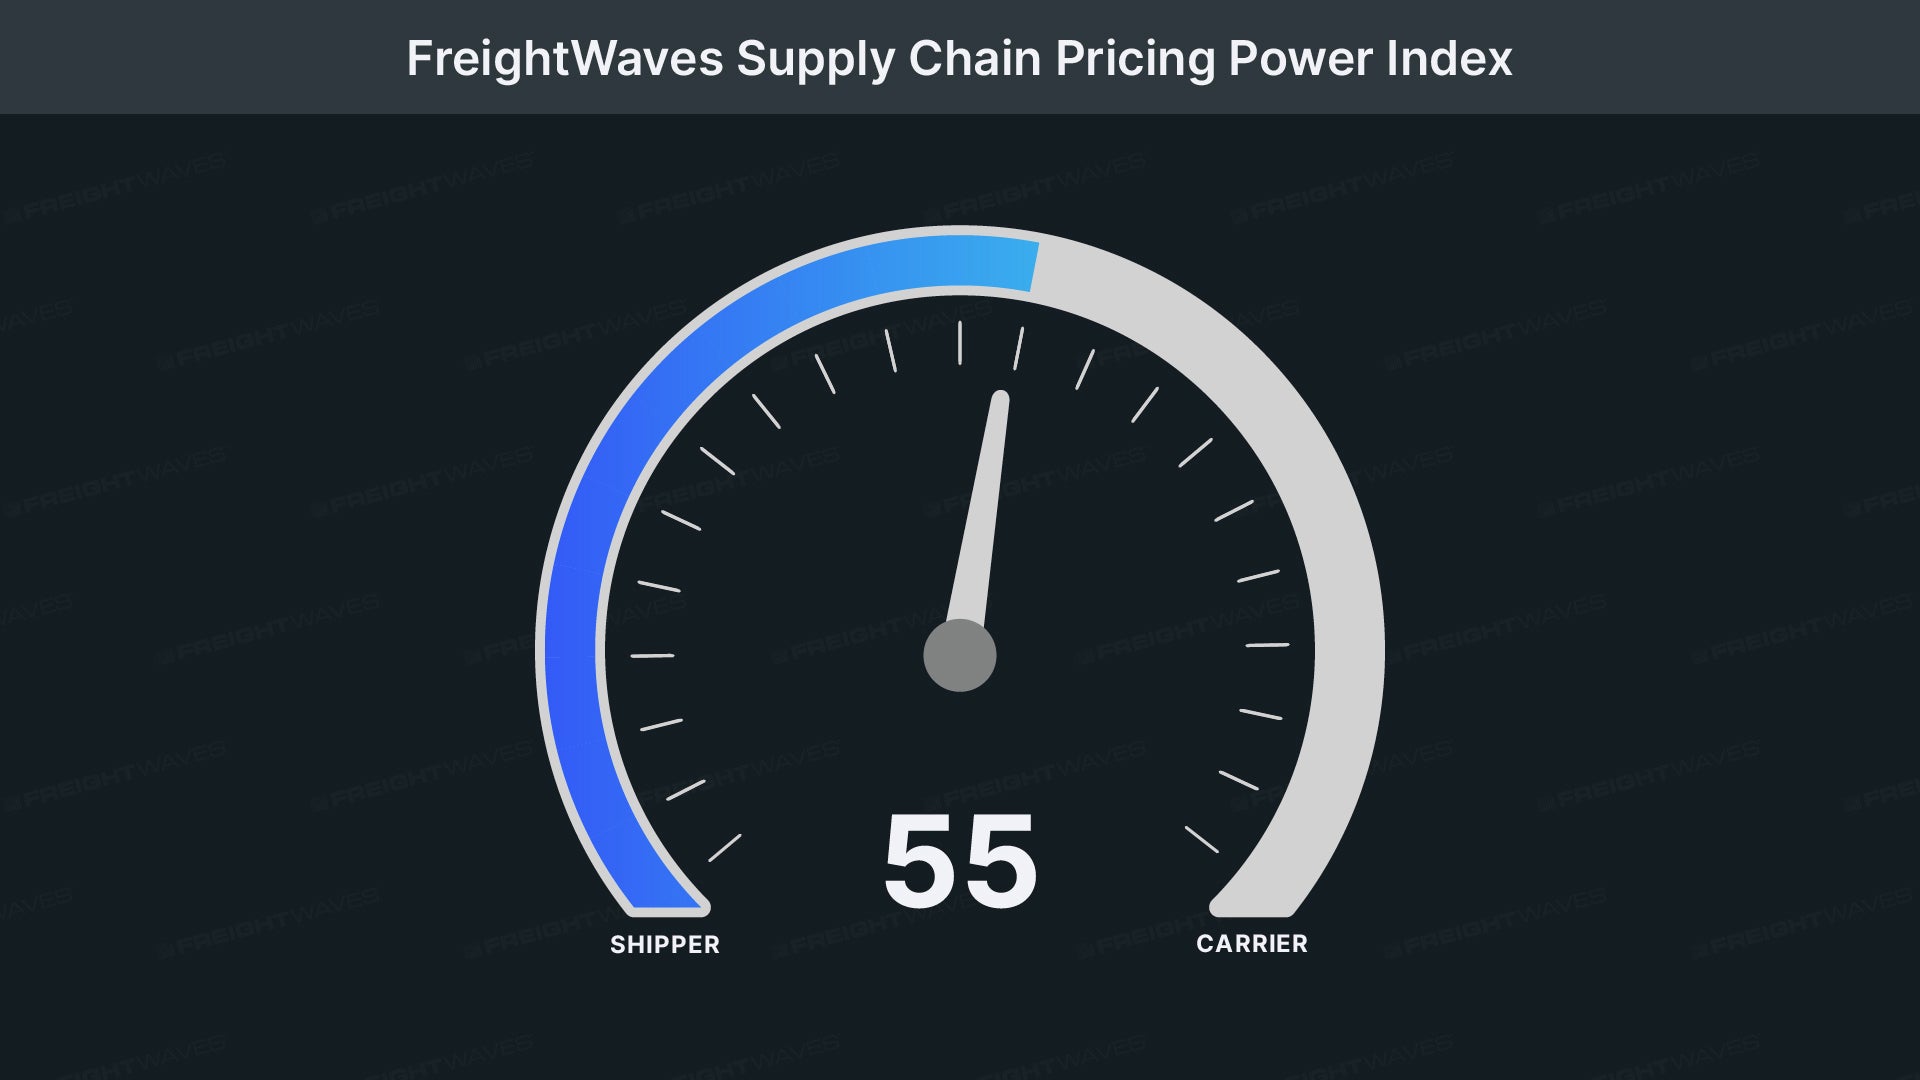
Even as carriers’ pricing power deteriorated, freight demand was consistently robust throughout February.
The FreightWaves Pricing Power Index uses analytics and data from FreightWaves’ SONAR platform to analyze the market and estimate the negotiating power for rates between shippers and carriers based on eight key market indicators.
Weekly updates can be found below.
Even as carriers’ pricing power deteriorated, freight demand was consistently robust throughout February.

The early stages of this recovery are characterized by a rebalancing market, a return to normalcy after a four-year roller coaster of volatility.
The sustained imbalance between supply and demand has yet to be corrected, such that only an unprecedented tidal wave of demand could satisfy the current amount of capacity in the national freight economy.
Spot rates did eventually see a boost at the start of the new year, albeit one that was unable to meet our prior forecasts.
Tender volumes began to outpace 2020 earlier this week and are now marching toward favorable comparisons with 2021.
Volumes are leveling out at the start of December, delaying the seasonal dip that ordinarily occurs at this time of the year.
Tender volumes were outpacing 2022 levels before the holiday and came within spitting distance of 2020 — freight demand’s second-best year on record.
This week, freight markets underwent a surprising rally that saw a wave of volumes sweep across the country.

Domestic manufacturers fail to inspire optimism, since they foresee major headwinds on output in the first half of 2024.
The upcoming months are littered with major holidays during which carriers can leverage seasonal constraints on capacity for higher spot rates.
Outside of the holiday rush periods, the fundamental lack of freight demand will continue to expose the lingering overcapacity in the market.
Given the surplus of available capacity, shippers are more confident in switching to “just-in-time” freight strategies as consumer resilience remains an open question.
By next week, it is likely that actual freight flow will have finally risen on a yearly basis for the first time since May 2022.
Consumer demand during the holiday season is expected to be relatively soft, which should temper expectations for a red-hot peak season in truckload markets.
Perhaps the most pressing question for both freight markets and the broader economy is how the consumer will fare in the coming months.
Rejection rates gathered some promising momentum in the run-up to Labor Day, though these gains are slowly being lost.
After a none-too-brief break, the Pricing Power Index is resuming its regular Friday schedule.
Against significant odds, the Federal Reserve might realize its once-unlikely goal of a “soft landing” — that is, taming inflation without also triggering a recession.
Freight volumes continue to trend sideways, which is a positive sign overall as the 15th of July traditionally marks a time for slowing demand in the freight market.
Demand from retail shippers is historically quiet in the period from now until August, after which retailers restock their shelves for the back-to-school season.

Demand from retail shippers is historically quiet in the period from now until August, after which retailers restock their shelves for the back-to-school season.
Maritime’s peak season — which typically ramps up in August and lasts throughout October — is expected by retailers and supply chain professionals to be weaker than it has been in previous years.
Tender rejections have yet to return to mid-May’s all-time low, but their softness could persist in a trough for the next two quarters.
One last round of bad news to cap this week: China and the U.S. both posted dismal data from their respective industrial economies.
Volumes did see some growth ahead of the upcoming Memorial Day holiday, though not nearly enough to bust out the champagne and sparklers.
So as not to bury the lede, this week’s lack of change in the PPI might ultimately prove to be the most exciting stability in quite some time.
Despite expectations for seasonal growth in the second quarter, the health of the American consumer has continued to become more precarious, stirring headwinds for even once-reliable sources of freight.
Volumes are just beginning to tick up at the tail end of April, but freight demand in the quarter has been mostly flat and thus grossly unseasonable.
While ocean carriers are not facing the same risks as their domestic trucking counterparts, given their consolidation and enormous war chests, ocean’s weakness in demand will continue to trickle down into truckload markets.
Despite seeing slight seasonal growth, truckload markets are showing a continued soft patch.
The gap between current levels of freight demand and those of 2019 is narrowing, casting doubt on the market’s ability to sustain growth.
The consumer will be key to resolving the present tension in freight demand’s future, but consumers continue to be predictably unpredictable.
Market conditions will likely become a bit more favorable before they get much worse.
Strangely enough, tender volumes are abiding by seasonal trends.
Strangely enough, tender volumes are abiding by seasonal trends. The first quarter of 2022 was unusually active as shippers tried to get ahead of disruptions to capacity, which historically tightens in the spring.
With the inflation-squeezed consumer running through their discretionary budgets, freight demand is in a precarious state.
Consumers’ appetite for discretionary spending has been usurped in favor of squirreling away income into personal savings.
Volumes have continued their recovery from the winter holiday season with a surge in pent-up freight demand unleashed into the market. Naturally, since last week’s data was affected by holiday noise, the Outbound Tender Volume Index (OTVI) faces some absurdly easy comps on a weekly basis. Even still, accepted tender volumes remain below their levels of 2021 and ’22 for the time being.
Volumes have continued their recovery from the winter holiday season with a surge in pent-up freight demand unleashed into the market. Naturally, since last week’s data was affected by holiday noise, the Outbound Tender Volume Index (OTVI) faces some absurdly easy comps on a weekly basis. Even still, accepted tender volumes remain below their levels of 2021 and ’22 for the time being.
For all intents and purposes, the month of December has only three weeks of freight activity, as the final week from Christmas to New Year’s is effectively null. In years prior, freight demand has fallen throughout the month before bottoming out in that final week. So far, December looks to be following seasonal trends, which is to say that, while shippers’ activity is winding down, this movement is not alarming by itself. Rather, the gap in freight demand between 2022 and ’21 (or even ’20) is the main symptom of current ailments.
For all intents and purposes, the month of December has only three weeks of freight activity, as the final week from Christmas to New Year’s is effectively null. In years prior, freight demand has fallen throughout the month before bottoming out in that final week. So far, December looks to be following seasonal trends, which is to say that, while shippers’ activity is winding down, this movement is not alarming by itself. Rather, the gap in freight demand between 2022 and ’21 (or even ’20) is the main symptom of current ailments.
Contrary to popular opinion, December is not a peak season for freight. True, the freight that needs to be moved in this month typically has greater urgency than usual, which does put upward pressure on carrier rates. But peak truckload volumes are largely influenced by maritime imports, which historically peak between July and September.
Historically, November is the month in which maritime imports begin to move inland for their final push before the holiday shopping season. Yet such imports were lost at sea this year, failing to materialize during ocean shippers’ peak season. This one-two punch of weakened import volumes and overstocked retail inventories means that carriers are left with fewer opportunities to source freight.
Historically, November is the month in which maritime imports begin to move inland for their final push before the holiday shopping season. Yet such imports were lost at sea this year, failing to materialize during ocean shippers’ peak season. This one-two punch of weakened import volumes and overstocked retail inventories means that carriers are left with fewer opportunities to source freight.
Since the pandemic started, many shippers found their existing contracts unable to ensure carrier compliance. Supply and demand were especially volatile, and so spot rates, which are more sensitive to changing market conditions, handily outpaced contract rates.
Since the pandemic started, many shippers found their existing contracts unable to ensure carrier compliance. Supply and demand were especially volatile, and so spot rates, which are more sensitive to changing market conditions, handily outpaced contract rates.
Since the pandemic started, many shippers found their existing contracts unable to ensure carrier compliance. Supply and demand were especially volatile, and so spot rates, which are more sensitive to changing market conditions, handily outpaced contract rates.
Hurricane Ian boosted spot rates in the southeast over the past 10 days, but as rejection rates and volumes decline, when will spot rates on a national level take another step lower.
Since the pandemic started, many shippers found their existing contracts unable to ensure carrier compliance. Supply and demand were especially volatile, and so spot rates, which are more sensitive to changing market conditions, handily outpaced contract rates.
Since the pandemic started, many shippers found their existing contracts unable to ensure carrier compliance. Supply and demand were especially volatile, and so spot rates, which are more sensitive to changing market conditions, handily outpaced contract rates.
Since the pandemic started, many shippers found their existing contracts unable to ensure carrier compliance. Supply and demand were especially volatile, and so spot rates, which are more sensitive to changing market conditions, handily outpaced contract rates.
Since the pandemic started, many shippers found their existing contracts unable to ensure carrier compliance. Supply and demand were especially volatile, and so spot rates, which are more sensitive to changing market conditions, handily outpaced contract rates.
Since the pandemic started, many shippers found their existing contracts unable to ensure carrier compliance. Supply and demand were especially volatile, and so spot rates, which are more sensitive to changing market conditions, handily outpaced contract rates.

FreightWaves founder and CEO Craig Fuller provides insight into the state of trucking contract rates.
Contract and spot rates continue their downward trend despite volume levels and rejection rates flattening out…
Since the pandemic started, many shippers found their existing contracts unable to ensure carrier compliance. Supply and demand were especially volatile, and so spot rates, which are more sensitive to changing market conditions, handily outpaced contract rates.
Since the pandemic started, many shippers found their existing contracts unable to ensure carrier compliance. Supply and demand were especially volatile, and so spot rates, which are more sensitive to changing market conditions, handily outpaced contract rates.
Since the pandemic started, many shippers found their existing contracts unable to ensure carrier compliance. Supply and demand were especially volatile, and so spot rates, which are more sensitive to changing market conditions, handily outpaced contract rates.
Since the pandemic started, many shippers found their existing contracts unable to ensure carrier compliance. Supply and demand were especially volatile, and so spot rates, which are more sensitive to changing market conditions, handily outpaced contract rates.

In the nine days since July began, OTRI fell 141 basis points (bps) to its lowest level in over two years: 6.7%. In the three days following that bottom, OTRI clawed back 50 bps. At present, however, it seems as though any upward momentum upon which it could have built has been lost.
Volume levels are depressed this week by Monday’s holiday. The national average rate of tender rejections sunk below 7% late in the week, but linehaul spot rates…
Volume levels have made a final push before the second quarter ends. The national rejection rate has recovered from its earlier dip below 8%…
Volume levels have restarted their decline, as have spot rates. The national rejection rate has fallen below 8%…
Volume levels have restarted their decline, as have spot rates. The national rejection rate has fallen below 9%…
Volume levels have restarted their decline, as have spot rates. The national rejection rate has fallen below 9%…
Volume levels have restarted their decline, as have spot rates. The national rejection rate has fallen below 9%…
Volume levels have restarted their decline, as have spot rates. The national rejection rate has fallen below 9%…
Volume levels have restarted their decline, as have spot rates. The national rejection rate has fallen below 9%…
Volume levels have restarted their decline, as have spot rates. The national rejection rate has fallen below 9%…
Volume levels have restarted the decline after recovering after Easter Weekend. The national rejection rate has fallen below 9%…

Tender volumes and tender rejection rates are both on a rapid decline, signaling trouble for the truckload market. Carriers and shippers alike will need to…
Spot rates continue the rapid descent as truckload capacity continues to loosen rapidly. At the same time, accepted tender volumes turn…
Tender rejection rates are rapidly headed toward single digits, causing spot rates to resemble a black diamond slope rather than the bunny…
Tender volumes and tender rejection rates are both on a rapid decline, signaling trouble for the truckload market. Carriers and shippers alike will need to…

Tender volumes and tender rejection rates are both on a rapid decline, signaling trouble for the truckload market. Carriers and shippers alike will need to…
Both tender volumes and tender rejection rates take a breather over the past week. It’s too early to be called a trend but definitely…

Both tender volumes and tender rejection rates take a breather over the past week. It’s too early to be called a trend but definitely…

Both tender volumes and tender rejection rates take a breather over the past week. It’s too early to be called a trend but definitely…
Tender volumes recover most of last week’s decline while rejection rates continue their slow downward trend despite contract rate increases…
Tender volumes take a February nap, sliding 4% over the past week while rejection rates were flat despite weather affecting certain markets..

Tender volumes continue to outperform year-ago levels. Rejection rates have declined throughout the past week as carriers return to major…
Tender volumes continue to outperform year-ago levels. Rejection rates have declined throughout the past week as carriers return to major…
Tender volumes continue to outperform year-ago levels. Rejection rates have declined throughout the past week as carriers return to major…
Tender volumes continue to outperform year-ago levels. Rejection rates have declined throughout the past week as carriers return to major…
Tender volumes continue to outperform year-ago levels. Rejection rates are continuing to rise in a unseasonable pattern placing pressure…
Rates reach new highs as capacity was slow to return to the road following the holidays. Tender volumes are soaring as demand is unrelenting…
Truckload volumes are beginning to erase holiday noise associated with Christmas and New Year’s. Rejection rates are staying elevated…
After a year of record revenue, carriers are staying of the road during the holiday weeks, holding rejection rates higher for longer…
Rejection rates are now back above 22%, the highest level since early September. Pricing power moved further to carriers despite the holiday related tender volume collapse.

Rejection rates have surged past the 21% level on the national level. Meanwhile, volumes have turned positive year-over-year. The combination of tightening capacity and stronger demand is placing upward pressure on rates.
Volumes turn downward heading into the Christmas week while rejection rates have rebound back above 20%. Carriers still maintain a firm grip on pricing power in the market.
Volume levels are following a similar trend to 2019, just 40% higher. Tender rejection rates are trending sideways, likely to move higher over the next week.
Tender volumes decline but remain elevated compared to ‘normal years’ meanwhile rejection rates have found footing around 20%.
Tender volumes decline but remain elevated compared to ‘normal years’ meanwhile rejection rates have found footing around 20%.
Tender volumes have started to erase the Thanksgiving noise. At the same time, rejection rates have plateaued around the 20% mark.
Thanksgiving noise continues to mask freight volumes, but that noise will be erased in the upcoming days. Meanwhile, Thanksgiving drove spot rates higher over the past week.
Thanksgiving always leads to a sharp decline in tender volumes. Leading into Thanksgiving freight markets experienced an uptick in accepted volumes.
Spot rates didn’t experience the uptick that rejection rates did last week. Thanksgiving is impacting both freight volumes and capacity.
Rejection rates have accelerated over the past week as drivers start to come off the road for the holiday.
Volume growth dissipates to kick off November while rejection rates remain well below year-ago levels.