


Tony Mulvey
Friday, November 12, 2021
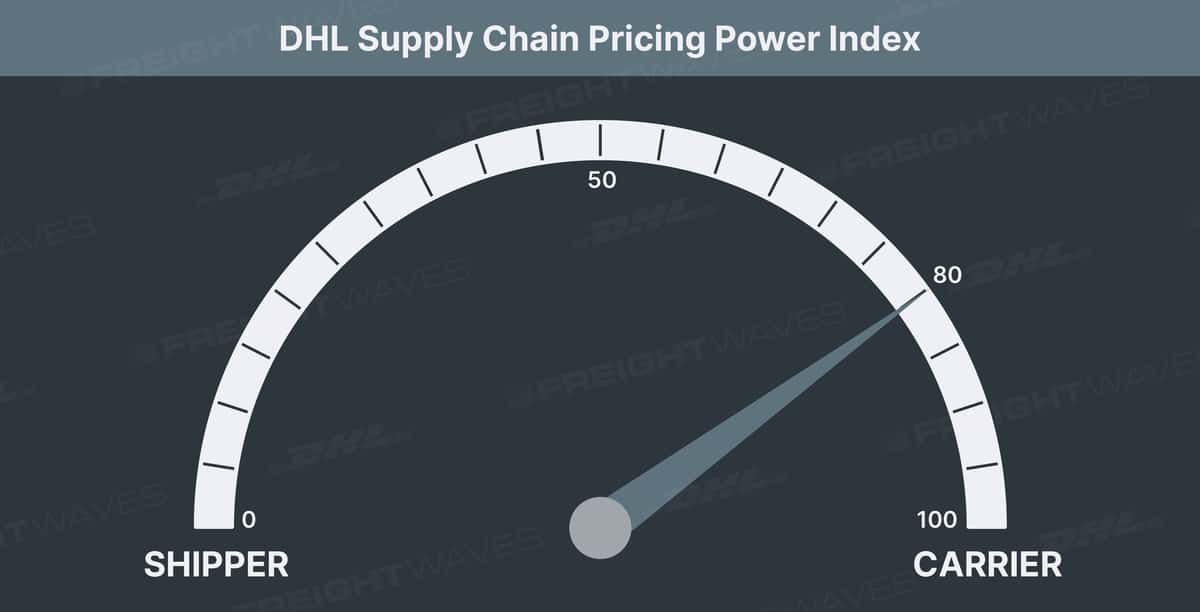
Shippers should be hesitant to push down rates just yet
Volume growth dissipates to kick off November while rejection rates remain well below year-ago levels.
The FreightWaves Pricing Power Index uses analytics and data from FreightWaves’ SONAR platform to analyze the market and estimate the negotiating power for rates between shippers and carriers based on eight key market indicators.
Weekly updates can be found below.
Volume growth dissipates to kick off November while rejection rates remain well below year-ago levels.
Volume growth dissipates to kick off November while rejection rates remain well below year-ago levels. Tightness in Southern California will put upward pressure on rates.
Volume growth dissipates to kick off November while rejection rates remain well below year-ago levels. Tightness in Southern California will put upward pressure on rates.
Tender volumes rebound as tender rejection rates jump back over 20%. Meanwhile, spot rates break the three-week downward decline.
Load volumes are stable with volume growth inbound. Spot rates follow rejection rates on a downward slide.
Load volumes are stable with volume growth inbound. Spot rates follow rejection rates on a downward slide.
Freight volumes in the largest markets are starting to accelarting, signaling the start of the peak truckload season.
Freight volumes in Southern California are starting to ramp, signaling the start of the peak truckload season.
Elevated accepted tender volumes and rates signal that carriers are maintaining pricing power. Truckload capacity constraints are easing as contract rates climb.
Strong freight volumes signal that carriers are firmly in the driver seat with regards to pricing power.
Strong freight volumes signal that carriers are firmly in the driver seat with regards to pricing power.
Spot rate snap back signals that carriers are firmly in the driver seat with regards to pricing power.
In this sensitive market, small changes to the balance have deep, long lasting impacts.

In this sensitive market, small changes to the balance have deep, long lasting impacts.
The rise in volumes continues to outpace the rise in rejection rates, and spot rates keep climbing.
Beginning in the second quarter, there was a notable shift in the types of loads shippers were tendering. Why would this assist with increasing compliance?
We’re two weeks into the third quarter, a time when seasonal freight movement moderates ahead of the back-to-school season and the eventual peak holiday season. Thus far, the moderation simply hasn’t materialized.
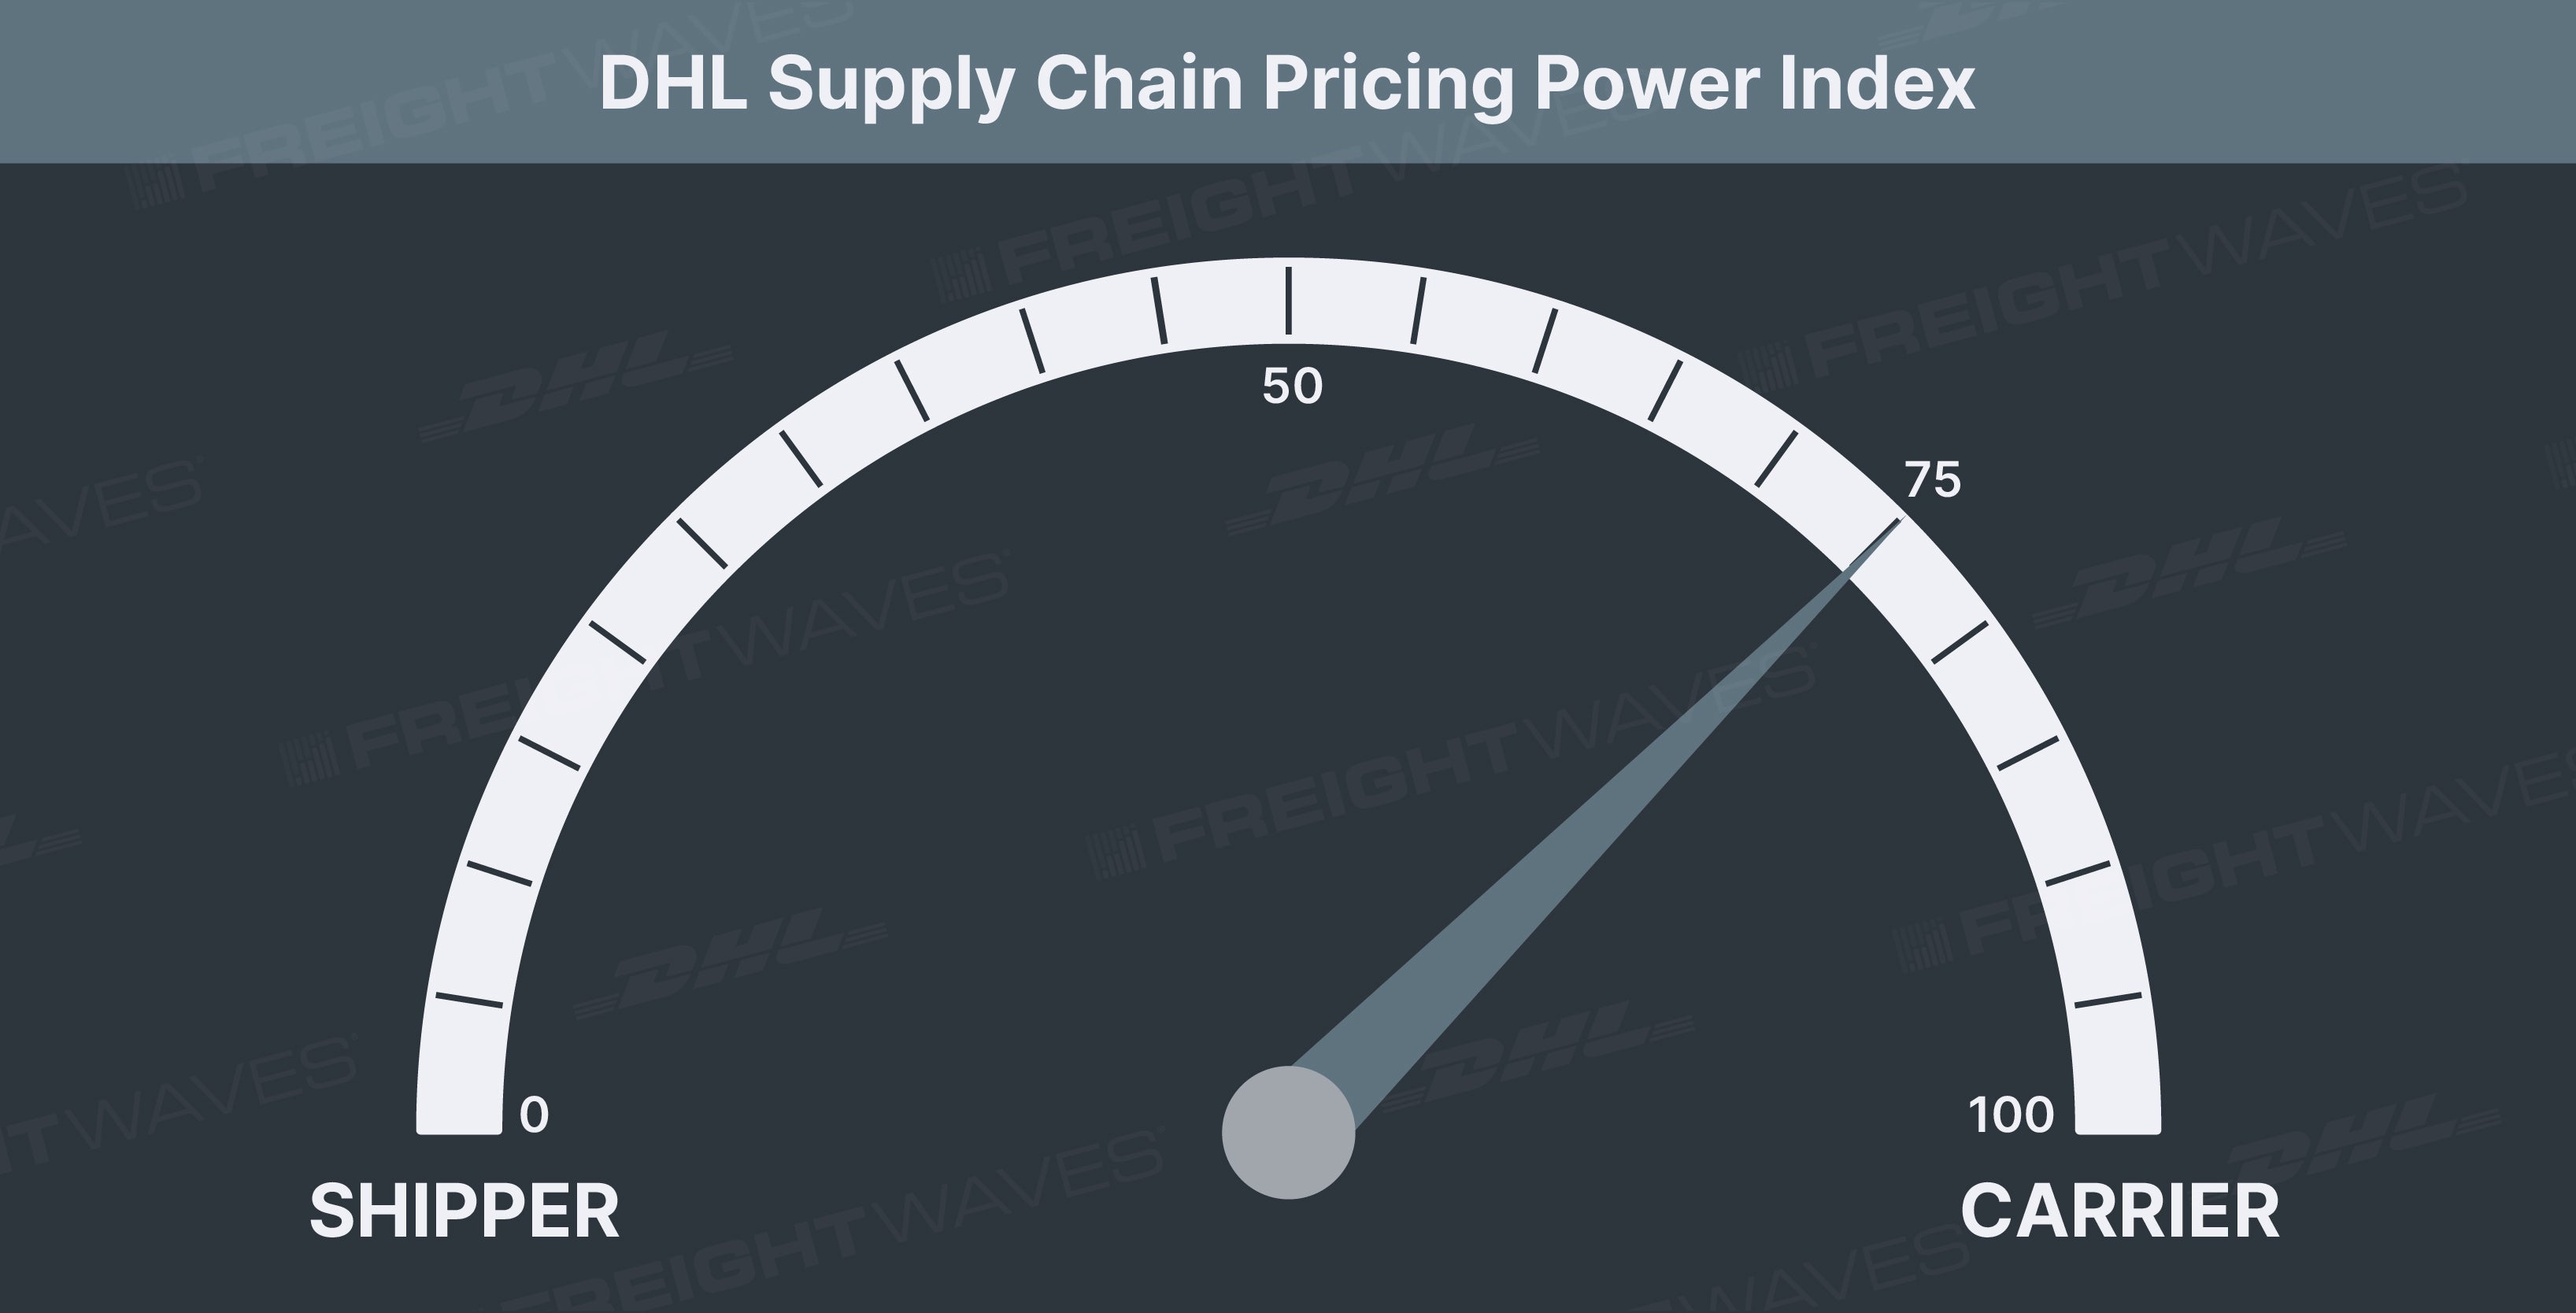
This week’s DHL Supply Chain Pricing Power Index: 75 (Carriers) Last week’s DHL Supply Chain Pricing Power Index: 70 (Carriers) Three-month DHL Supply Chain Pricing Power Index Outlook: 70 (Carriers) […]
Reefer rejection rates tumbled once again over the past week, and the national reefer rejection average is now below 40% for the first time since the second week of September.

Unlike freight demand, the typical things we see play out on the capacity side of the equation prior to a holiday have not (at least to this point).
Freight demand is not going to abate in the next few months, and there will not be any meaningful addition to fleet capacity in the meantime. This is a carriers’ market and will stay such throughout the summer.
are pumping across the country, but it seems routing guides have finally shown signs of improvement. Pair the declining electronic tenders with declining tender rejections, fewer spot volumes, and both contract and spot rates headed lower, the picture of an improving environment can be visualized.
Freight demand is not going to abate in the next few months, and there will not be any meaningful addition to fleet capacity in the meantime.

Consumer spending tapered off this week, but the savings rate is so high, Americans have a war chest unlike in any recent period. And, inventories remain depleted across many segments, so the freight industry won’t feel the direct brunt of any shift back to services anytime soon.
The market takes a breather this week with tenders down 7% week-over-week.

Service-based spending categories like airlines, lodging and restaurants all were positively impacted by the stimulus, but the top 5 biggest growth segments came in goods. With the roaring consumer economy, blossoming industrial recovery, white-hot housing market and historically depleted inventories, there’s very little outside of severe inflation that could derail this trucking market.
The stimulus is providing a huge boost to Americans, who by and large, still remain unable to spend on big-ticket services like concerts, sporting events or amusement parks. The recent stimulus has created the strongest spending gains in furniture, online electronics and clothing.
If you look at the weekly Outbound Tender Volume Index (OTVI) map, you might think freight markets have reversed course and are retreating significantly. But this line of thinking is misguided. Tender volumes are coming down, but off an unnaturally high base. Volumes in most major markets remain above pre-storm levels.
The freight markets have reentered “chaos is business as usual” territory. All the major indices have been eerily calm since the winter storm disruption. Yearly comps are becoming more difficult given the panic buying that shot volumes and rejections up this time last year. Don’t let the weakening comps distract you, this market can’t get much better.
Leverage is firmly in carrier’s favor.

There are many variables converging that will keep upward pressure on spot rates and tender rejections for the coming weeks. Carriers will be able to squeeze extra cents per mile over the next couple of weeks. Assets will come back online sooner rather than later, but volumes are beginning to pick up both seasonally and due to a whipsaw effect from the storm.

We believe the winter storms tip the scales in carriers’ favor ever so slightly. Freight markets were already imbalanced with seemingly insatiable demand overwhelming already strained carriers, and it’s only February.
Spot rates move up for the first time in 5 weeks.

Without much volatility in volumes and rejections over the past three weeks, freight markets have seemingly found their groove. The tune is akin to Berlin techno. To some, its pace is smooth and machine like. To others, its pure chaos.

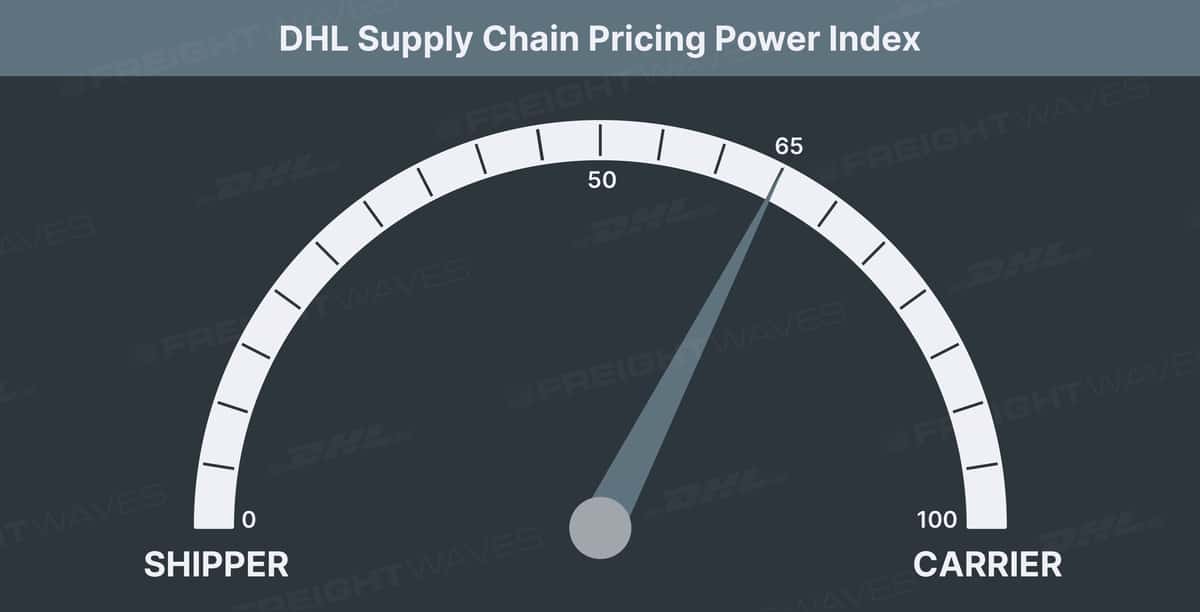
This week’s DHL Supply Chain Pricing Power Index: 70 (Carriers) Last week’s DHL Supply Chain Pricing Power Index: 65 (Carriers) Three-month DHL Supply Chain Pricing Power Index Outlook: 75 (Carriers) […]
We may be seeing signs of a traditional January lull, but at a much higher level than years past. On a rejection-adjusted basis, tender volumes are running up 23% yoy versus 20% last week. Tender rejections continue to decline modestly, but carriers are still rejecting more than 1-in-5 contracted tenders. Stimulus can only carry the freight markets so long. Fortunately, the industrial economy is revving up and retailers have significant restocking ahead.

The Outbound Tender Reject Index has declined substantially since the beginning of the year. This shouldn’t be seen as a sign of a material capacity loosening, rather an effect of the ongoing rebid season pushing contract rates higher.

The stage is set for a historically strong Q1 for freight with a slow vaccine rollout keeping a lid on services spending, and consumers are flush with recent stimulus as well as the hopes for more to come. The freight bull market rages on to start 2021.

There is a strong pipeline of West Coast imports that should feed those markets well into Q1, but the retail portions will be less time-sensitive post-Christmas. The one factor that may be suppressing volumes in the holiday season is retailers’ decision to slow the velocity of their sales in the face of low inventory levels.

In the heat of peak holiday season, our thesis is largely the same: relatively tight capacity, strong volumes and positive cyclicality. The low inventory-to-sales ratio, strong consumer sentiment and spending, lack of service-based spending options and acceleration of e-commerce growth all bolster our belief.

Both truckload tenders and tender rejections rose this week. If spot rates are to continue the succinct but lagging dance with tender rejections, we should see spot rates inflate over the next two weeks. Also, with Thanksgiving just a week away, drivers will be seeking freight that drives them toward home, which typically pushes rejections and spot rates higher.

We expect strong holiday truckload and parcel demand
driven by a consumer spending portfolio that has been weighted heavily toward goods over services since the pandemic began. We believe that we are now in peak season and that shippers’ requests for trucking capacity will continue to rise.

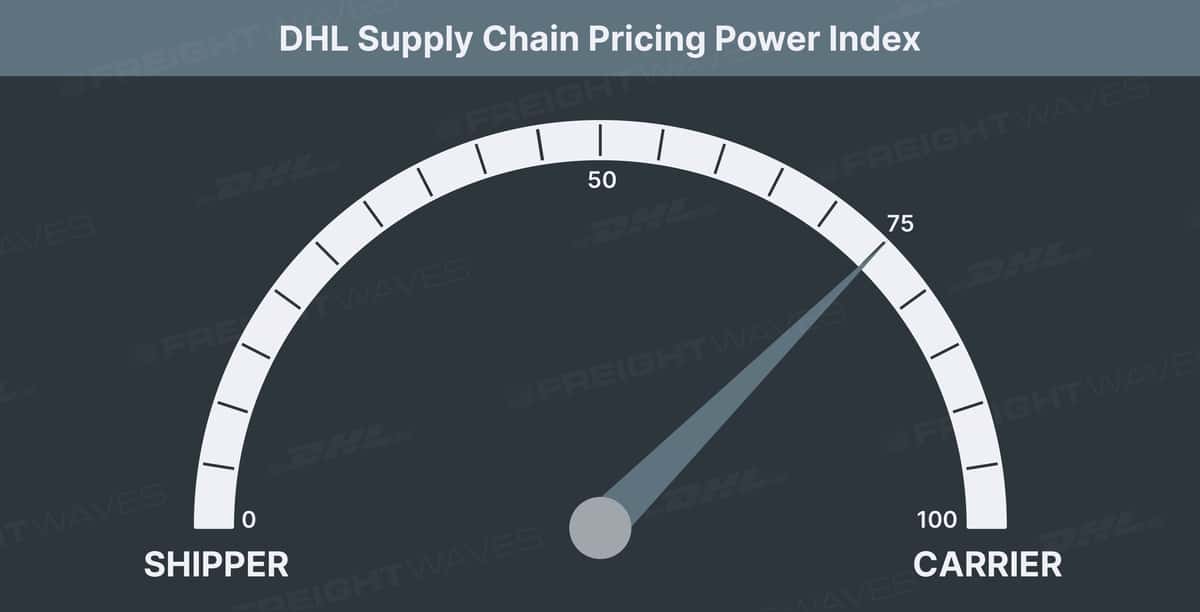
This week’s DHL Supply Chain Pricing Power Index: 80 (Carriers) Last week’s DHL Supply Chain Pricing Power Index: 75 (Carriers) Three-month DHL Supply Chain Pricing Power Index Outlook: 65 (Carriers) […]

Freight volumes and capacity remain historically strong for carriers even though OTVI and OTRI have fallen steadily throughout October.

This week’s DHL Supply Chain Pricing Power Index: 75 (Carriers) Last week’s DHL Supply Chain Pricing Power Index: 80 (Carriers) Three-month DHL Supply Chain Pricing Power Index Outlook: 75 (Carriers) […]

Carriers lose marginal ground this week as tender volumes, tender rejections and spot rates slip. Carriers remain in an advantageous position heading into the holiday season.

We have officially moved back into “broken record” territory that we have not seen since February. While volumes are flowing at record levels and capacity is as tight as it’s ever been, there is little volatility at the moment.

If you had told carriers they would see $3 a mile at any point during a global event like this, I believe many would have questioned your sanity. Yet, here we are with the Truckstop.com national spot rate average sitting at $2.93 per mile on Oct. 1.

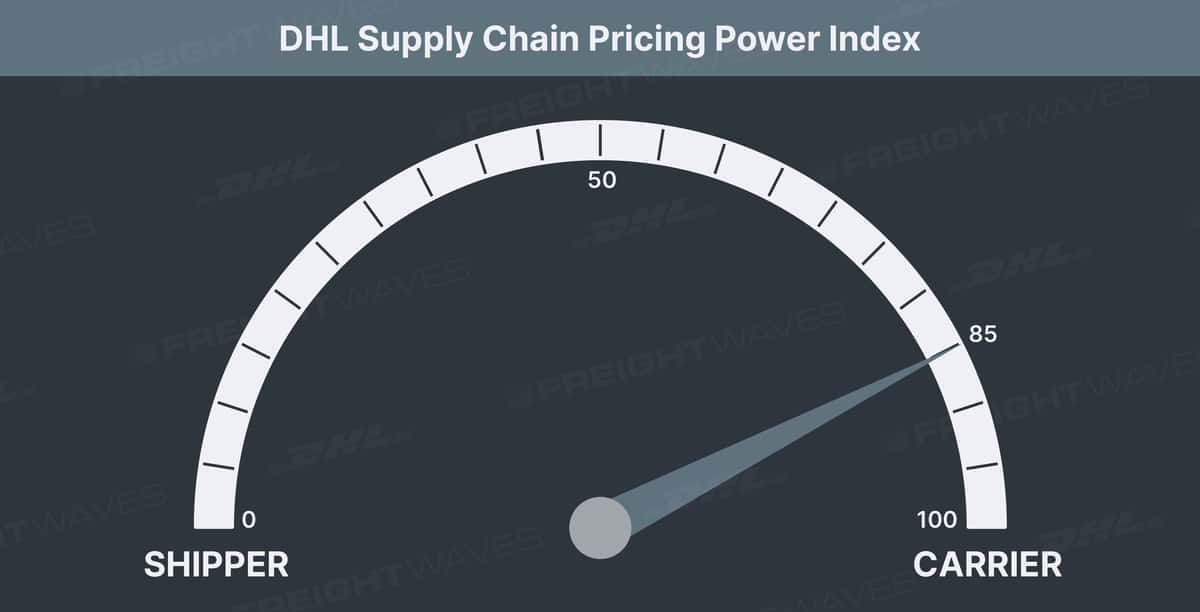
This week’s DHL Supply Chain Pricing Power Index: 80 (Carriers) Last week’s DHL Supply Chain Pricing Power Index: 85 (Carriers) Three-month DHL Supply Chain Pricing Power Index Outlook: 80 (Carriers) […]

We have gotten word that carriers are holding capacity until the end of the day before auctioning it to the highest bidder. Rates are nearing $3 per mile on a national level, and rates are already above that in 51 of 100 Truckstop.com lane pairings.
Carriers are rejecting as much freight now than at any point in the past three years. Spot rates poised to break $3/mile on a national level.

Accepted freight tenders are running up 18% year-over-year. Carriers are rejecting 1 in 4 contracted tenders and driving rates up. National spot rates above $2.75/mi. and trending higher.

Spot rates out of LA and Dallas are remarkably high and the tight capacity in those markets is driving the freight cycle.

Buckle up, folks, this should be good. Volumes are gushing and rates pushing higher.

The carriers did not lose ground this week, but rather further solidified their dominant pricing position. Volumes remain well above 2018 and 2019, running in the +20% to 25% range. The elevated volumes are giving carriers options in the market and they are exercising those options at a high clip.
There is no change in the Pricing Power Index this week despite a continuation of the trends we’ve seen over the past few weeks: astounding volumes, carriers rejecting contracted freight at a high clip and rates continuing to trudge upward.

Carrier momentum continues.

Carriers continue their power grab this week adding 10 points and hitting another new series high. Volumes remain in the stratosphere, and carriers are rejecting contracted freight at levels unseen since the summer of 2018.

Carriers are inteh strongest position in the DHL Supply Chain Pricing Power Index’s 10 month history. Rates have pushed higher in recent weeks as carriers reject more freight than anytime in 2019 and volumes remain elevated.

The Independence Day holiday disrupted both our OTVI and OTRI this week. Volumes are poised to bounce back and remain elevated after the moving average distortion is over.

This week’s DHL Supply Chain Pricing Power Index: 55 (Carriers) Last week’s DHL Supply Chain Pricing Power Index: 50 (Balanced) Three-month DHL Supply Chain Pricing Power Index Outlook: 60 (Carriers) […]

The carriers gained significant pricing power this week. Volumes continue to burst from the seams and tender rejections have skyrocketed in the past week.

The carriers continues their power grab this week. Shippers remain in control, but carriers are much better off than they were a few weeks ago. Capacity is beginning to tighten and rates are being pushed up.

Carriers gained another 5 points of pricing power this week. This marks 6 weeks of power gains, but shippers remain in control.

The carriers gained pricing power this week on the back of surging volumes. Capacity remains loose although tightening each of the past five weeks.

This week’s DHL Supply Chain Pricing Power Index: 25 (Shippers) Last week’s DHL Supply Chain Pricing Power Index: 20 (Shippers) Three-month DHL Supply Chain Pricing Power Index Outlook: 50 (Balanced) […]

This week the carriers gain some pricing power on the back of surging volumes. Tender rejections are beginning to show signs of life and spot rates are up in most markets.

The DHL Supply Chain Pricing Power index moved up for the first time since the volume surge in March. The index now sits at 15, which is still positions the shippers comfortably in bid negotiations.

National volumes and tender rejections have been roughly flat for the past week. There is no change in the DHL Supply Chain Pricing Power Index this week. Shippers remain in dominant pricing power position.

The DHL Supply Chain Pricing Power Index fell another 5 points this week to its lowest total in series history. Volumes are beginning to come back to life, but capacity remains historically loose and spot rates are extremely low.

The shippers are in the strongest pricing power position in the DHL Supply Chain Pricing Power Index history, but for all the wrong reasons. Volumes are stable, but well below normal levels, and tender rejections are at the lowest level in the index’s 3-year history.

Pricing power shifts towards the shippers in a major way this week. Contract freight volumes are now at Labor Day 2019 levels and are poised to go lower. Rejection rates are encroaching on a rare 4% mark, and spot rates are in the bin.

Carriers give back pricing power as volumes and rejections rates plummet. Spot rates are negative week-over-week for 95% of lanes from Truckstop.com.

National freight volumes and tender rejections are falling as fast as they rose. Carriers remain in slight pricing power position, but their footing is slipping with each passing week,

While this may be the peak pricing power for the carriers for this freight cycle, the carriers gain another 10 points in the DHL Supply Chain Pricing Power Index this week.

The continuation of panic buying and restocking has swung the DHL Supply Chain Pricing Power Index violently to the upside. Carriers are now in dominant pricing power position for the first time since we began this series in September.

American consumers are panic buying goods from every aisle. To meet this spike in demand, shippers must procure trucking capacity at higher-than-contracted rates creating a significant 15 point swing to the carriers.

The carriers gained pricing power this week as volumes jumped over 6%, capacity tightened slightly and spot rates increased across the country.

The coronavirus has made its first impact upon the American economy – the stock market. The novel virus is also impacting import volumes from China and the effect will quickly trickle into the trucking market. It has not yet, but will soon. This week, spot rates bounced back slightly with a bump in outbound volumes. Capacity remains very loose.
This week, the shippers gain pricing power for the 5th time in the first seven weeks of 2020. Volumes are flat, rejection rates are low and rates are even lower.

In a monotonous week in the freight industry, we believe neither the shippers nor carriers gained any pricing power.

Shippers gain another 5 points of pricing power in this week’s DHL Supply Chain Pricing Power Index.

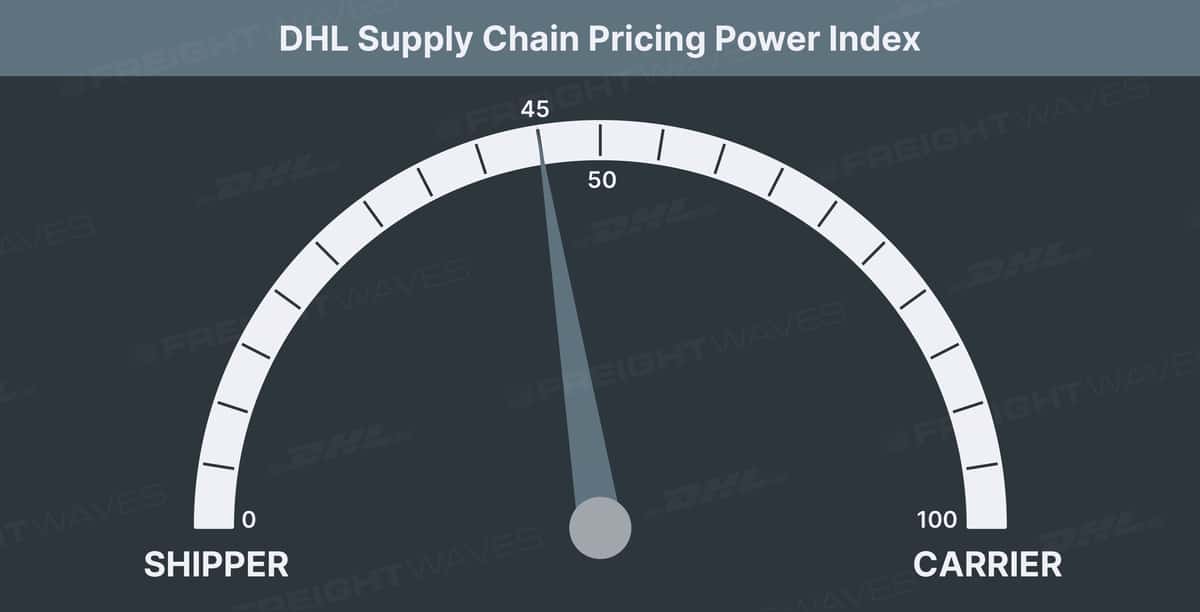
This week’s DHL Supply Chain Pricing Power Index: 30 (Shippers) Last week’s DHL Supply Chain Pricing Power Index: 35 (Shippers) Three-month DHL Supply Chain Pricing Power Index Outlook: 45 (Shippers) […]

Despite strong economic data in favor of the carriers, flat volumes and loosening capacity garners a power grab by the shippers.

Outbound volumes and rejections were horizontal this week. Target’s poor earnings are not enough for us to believe the retail sector is in danger of a slowdown, but it is slightly alarming.

In the second DHL Supply Chain Pricing Power Index of 2020, the shippers gain power for the first time in 7 weeks. Look for the shippers to continue gaining power for the next few weeks.
Peak season is wrapping up after bringing the carriers something to cheer for after dismal 2019.
Tender rejects have now risen 170% since Nov. 1, 2019.

Tender rejections above 10 for the first time in 2019, volumes are holding and holiday rates are cheery.

Momentum for carriers holding as volumes, rejections and rates are moving in their favor.

Increased rates and signs of capacity slowly leaving the market continues the power shift towards carriers.

The DHL Supply Chain Pricing Power Index moves towards the carriers for the first time since early September.

No good news for carriers besides a slight surge in volumes leading into the late Thanksgiving holiday.

Mixed economic data and lower volumes prompt no movement in this week’s DHL Supply Chain Pricing Power Index.

Third-quarter earnings reports and economic data swing in carriers’ direction, but not enough to move the needle in this week’s DHL Supply Chain Pricing Power Index.

Slight rallies in volumes and rejections not enough to keep power from shifting further towards shippers.

This Week’s DHL Supply Chain/FreightWaves Pricing Power Index: 25 (Shippers) Last Week’s DHL Supply Chain/FreightWaves Pricing Power Index: 25 (Shippers) Three-Month DHL Supply Chain/FreightWaves Pricing Power Index Outlook: 45 (Shippers) […]

Weak tender load volumes and rejections this week push the index toward shippers.

This Week’s DHL Supply Chain/FreightWaves Pricing Power Index: 30 (Shippers) Last Week’s DHL Supply Chain/FreightWaves Pricing Power Index: 30 (Shippers) Three-Month DHL Supply Chain/FreightWaves Pricing Power Index Outlook: 50 (Balanced) […]
Last Week’s Pricing Power Index: 35 (Shippers) The trucking industry operates in a market based on real-time demand and supply. When demand is higher than capacity, carriers gain negotiating power […]

Hear from owner-operators and safety personnel to stay ready for the challenges of the road