


The views expressed here are solely those of the author and do not necessarily represent the views of FreightWaves or its affiliates.
Forecasting is hard enough to do when you have accurate and timely data. It’s almost impossible when your data is not up-to-date.
There is an old adage: Forecasting is like driving blindfolded while your partner looks rearward and telegraphs the next turn based on what you recently passed. That is tough to do on a curved road. It is mpossible on a road never taken.
Railroad freight is a derived demand economic function because cargo moves when there is a market demand.

Who sets the demand? It’s typically the receivers that set the demand table. Yes, the critical mass to projecting a forward business volume is the buyers.
A map highlighting the delivery geography is the prime intelligence source for almost all freight forecasting.
In practice, one must examine both the origin and destination together with the alternate transit paths. There is complexity. Sometimes there is a middleman that changes the scope and the path and the timing of cargo movements.
A fuel change and a market slowdown or a price drop in certain commodities can also change the path and the chosen freight carrier mode.
Thinking about railway freight specifically, let’s briefly consider the essential planning factors that will influence the outlook for the remaining weeks in the second quarter of 2020.
The setup for rail freight is that it moves bulk cargo and industrial cargo. That covers the core rail carload sector. Carload traffic volume is more profitable on a per railcar revenue basis and much larger as a percentage of cargo relative to intermodal traffic (trailers and containers on trains).
If we just focus on intermodal rail, we miss the heart of the still extremely profitable carload freight business model that drives the seven big Class 1 railroad companies.
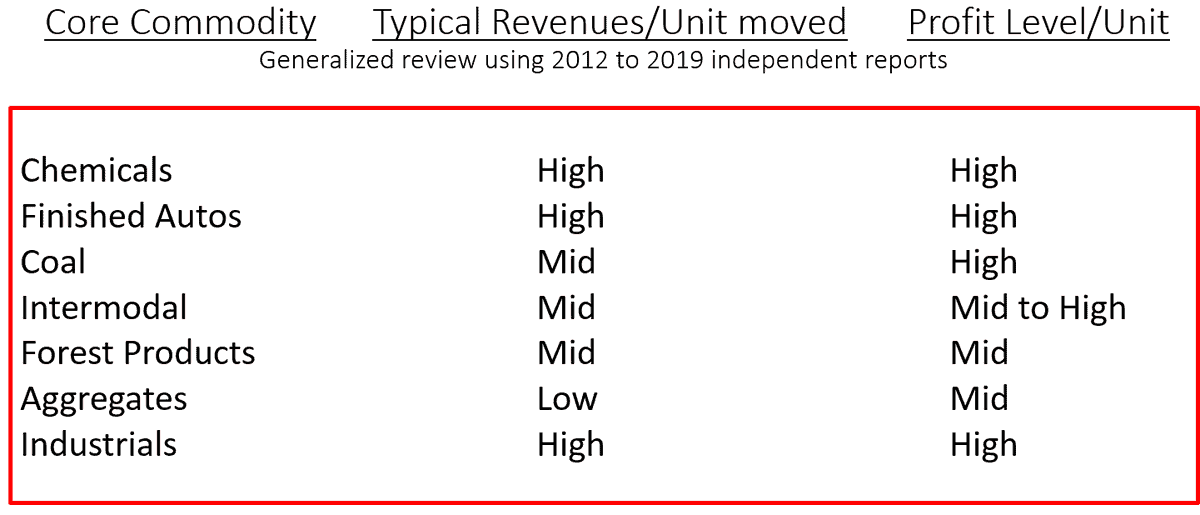
Here is a simple profile of where the railroads most hope to preserve or to grow their 2020 business volume. These commodity sectors are important because they are where the money is for a strong financial result.
What’s the official railroad company traffic volume and return to volume growth outlooks?
Collectively, they are very silent. None are effectively telegraphing the next turns ahead. In investor relations terms it means eliminating their “forward guidance.”
Here is a sample of the non-forecasting language:
CSX withdrew its guidance for the rest of the year. Why? It is “too wide to predict at this time” according to the company’s president and chief executive officer.
Kansas City Southern has withdrawn its previous full-year earnings forecast. It is also reducing its 2020 capital expenditures by about 10% from the original target of ~$500 million. That might drop later by a full 20% depending upon evolving conditions.
Norfolk Southern Corp. withdrew its previous outlook for flat full-year revenue. It has not yet signaled how much its second quarter 2020 volumes will decline. Instead, it has signaled a so-called “doubling down” on lowering its structural costs as a means of driving profits. That suggests a financial outlook rather than a marketing message.
In railroad freight messages, the choice of metrics and the wording of the messages about their companies’ futures often emphasizes the financial scorecard. Customers and volume growth are not emphasized in the wording.

The anticipated pivot towards traffic volume growth and capture of trucking market share is hard to discern.
If the industry internally isn’t clear, that leaves us with speculation. My sources tend to be railroad customers and what they are broadly saying and doing about the next few months of the business.
We must interpret from the customer side without a direct contact to the changing railroad metrics.
True, we can examine broad system-wide reported traffic data for multiple commodity types. That data is published weekly.
But it is difficult to see the data in terms of changing market to market origin and destination corridor flows. The geography of rail freight transport is somewhat blind.
We can see trucking traffic by geography in near real-time, but not the rail carload volumes. The only way to do that is to use inferential modeling and secondary reporting access data such as from port records.
The problem is that there is a data capture lag time.
Remember our road trip partner in the car? This is like asking for the next turn ahead when she or he hasn’t seen the road behind yet.
Here are examples of what the outside market is seeing. It remains troubling; there is not much buoyancy.
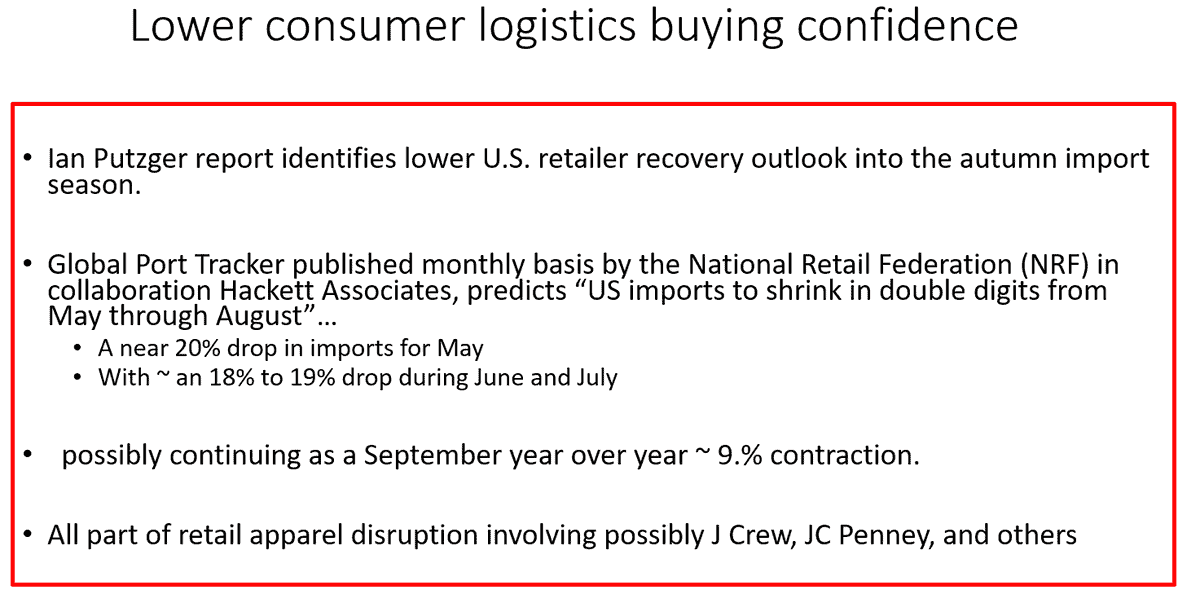
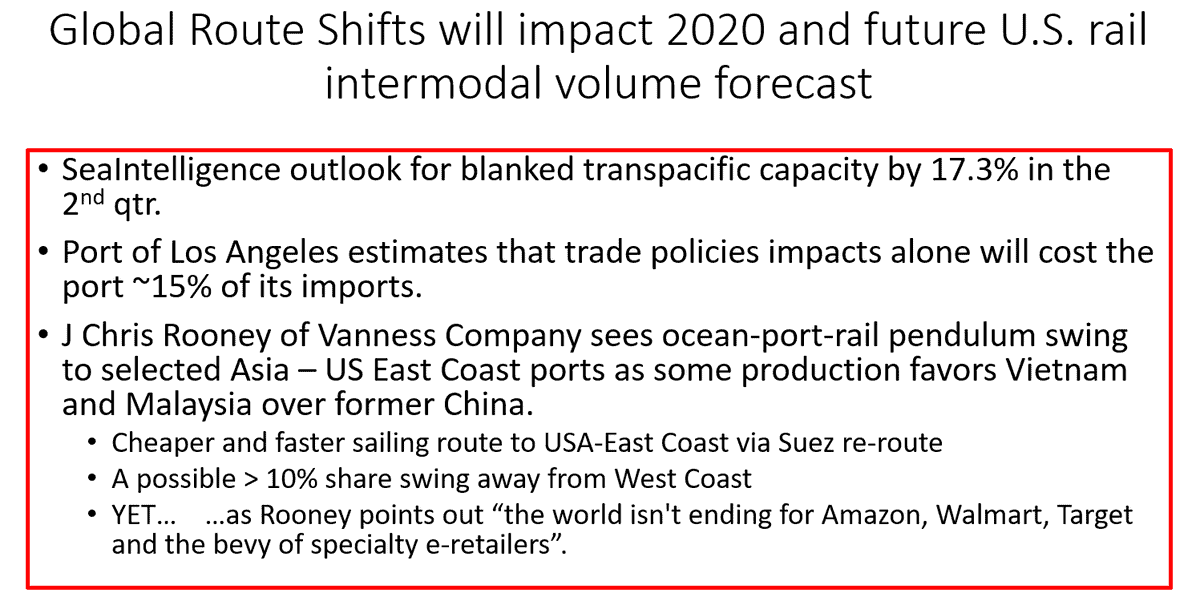
How will intermodal rail play in the second quarter? Here are a few informed views.
With five weeks to go until the end of June, what’s the rail freight call?
In broad terms, here are separate volume numbers for intermodal and carload. It assumes a tepid U.S. economic recovery out over about six weeks.
Intermodal likely continues to show much slower returning traffic growth than expectations for the trucking sector. The primary reason is that intermodal does not carry much e-commerce merchandise. In addition, the possible return of the retail economy will be primarily truckload based because of speed and reliability.
Domestic intermodal is still 10 to 15% below that of June 2019, while international intermodal is still down 18% or more below June 2019.
Here is an independent view of the intermodal outlook as shared by FTR’s Eric Starks and colleagues. We might not yet be in the so-called restart of the railroad-served economic recovery phase yet. This data view as of May 13th.
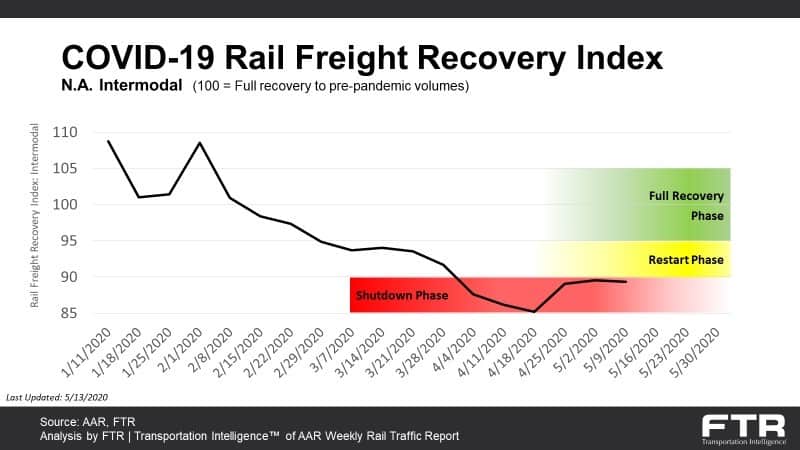
How bad is this visually? Check out the FTR plotted trend of current early May data versus the five-year plotted intermodal volume. Intermodal volume might still fall further year-over-year in this four-week average plot out to just beyond week 26. We will have a sharper view in about four weeks.

Carload freight is likely to see much larger variances in traffic volume decreases than intermodal.
Canadian traffic will see a somewhat different pattern, perhaps a bit better in volume than that across the U.S. rail network.
Mexican railroad traffic will, like that of the U.S., see a negative impact largely related to the fortunes of how many new cars the automakers build and ship to their dealers. This is part of the market demand hypothesis being found at the delivery end rather than the origin.
Humbly, this is my offered level of confidence as to the total second quarter volumes:
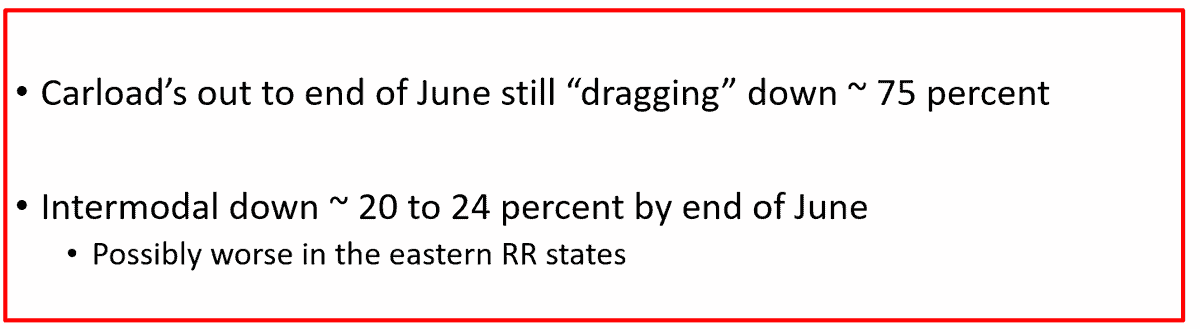
Overall selected rail carload commodities such as finished autos or perhaps lumber will likely continue to see very high year-over-year percentage variance as suggested below even as a recovery begins.
The end of the third quarter outlook is less certain. There are some optimists that should not be ignored.
Roy Blanchard closely follows the Class 1 railroad and shoreline carload business sector. He likes the UBS Global Research contrary focus.
Their three-part counter is simple. Investor sentiment has rarely been this depressed. While a bearish sentiment is over 50% in some surveys, there may be a sign of a rebound underway. For example, the CRB Commodity Index has “stabilized.” Maybe.
Lumber prices have retraced almost 50% of their COVID-induced decline. Does this reflect the gradual re-opening of the U.S. economy or rather a sort of desperate pricing for cash flow by sellers?

If stimulus payments by the federal government work as some suggest, then we might indeed see a rebound in cyclical sectors like energy, materials and industrials.
What’s your expectation?
Meanwhile, who within the railroad carrier sector will survive and who might stumble?
For the Class 1 railroads, there is an optimism that they will demonstrate resiliency in financial terms. Positive net cash flow from a somewhat less efficient productivity but still perhaps in the high 60s to at worst very low 70s “operating ratio level” will mark a second quarter success for investors.
It appears that North American railway freight will remain the most profitable of the freight modes entering the summer.
This economist’s confidence level is about 95% or better for financial health.
Some short lines that specialize in selected commodities as their core regional business may stumble in both volume and in their reported second quarter accounting. Clearly this pandemic is a market test.
Here is the broader rail-centric outlook for a year from now (the second quarter of 2021).
Intermodal volume across the USA – likely down as much as 23%. The eastern short-haul rail lines may possibly be down even more – in the range of 26%.
![Intermodal Loadings (000s) [Line]](https://www.freightwaves.com/wp-content/uploads/2020/05/Blaze7-052620.png)
The single market commodity that is a huge waiting opportunity is grain. In contrast, crude oil, fracking sand and coal are challenges as their markets continue to morph.
Chemicals and petrochemicals like plastics are still a good bet for rail traffic gains over the next decade. Auto traffic will grow again if the travel industry and the disposable income of the American consumer can recover at a reasonable pace.
If Congress and the Trump administration can reach a political resolution that results in safety-related modernization of roads and bridges, that should spur primary metals- and aggregates-related growth for the railroads. But this remains a big “if” scenario.
As for the continuing shift in market share from railroads to trucking, that’s not really a pandemic issue. It is a business issue.
It’s going to be decided largely in the halls of each of the separate Class 1 railroads. If the large railroads decide to share their productivity gains from the recent precision scheduled railroading business change – as they did four decades ago from productivity gains of the Staggers Act, then competitive pricing should shift railroad demand-side customers (the receivers) back to using more rail services.
When we see that cost savings sharing occurs, my level of confidence as the volume and share pivot will be in the high 90s. That is my market view.
What’s yours?
Despite all of these expert opinions, you the reader have to make a judgment. The best strategy is a reasonable high to low range – and then pray for a market migration “to the mean.”
Best forecast bet? That we are blessed by a combination of herd immunity and a successful vaccine.
