


The good news is that there were fewer than 100 container ships stuck waiting off North American ports on Friday. The bad news is that there were still 99 container ships offshore and the pre-COVID norm was in the single digits.
There’s still a long way to go to clear the backlog. But the current tally is now back to June levels and 35% off recent highs.
The number of ships waiting off North American ports peaked at around 150 in January, with waiting vessels almost entirely off the West Coast. The queue fell through the spring as Los Angeles and Long Beach, California, improved their cargo flows. It rebounded back to over 150 in late July, propelled by traffic jams off East and Gulf Coast ports. It has gradually declined since then.
According to an American Shipper survey of MarineTraffic ship-position data, together with the latest queue lists from California ports, there were 27 container vessels off the West Coast and 72 off the East and Gulf coasts as of mid-day Friday.
East and Gulf Coast ship queues
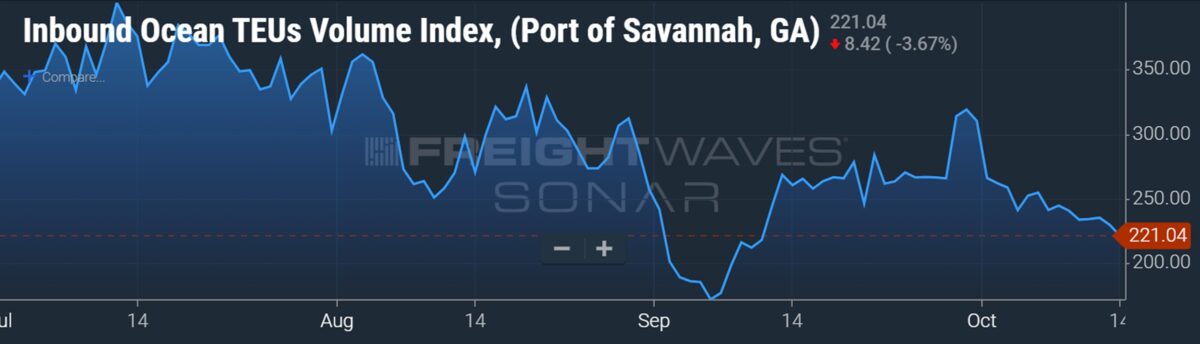
Savannah, Georgia, continues to have the largest queue, with 29 container vessels waiting. That’s well below the peak: In early August, Hapag-Lloyd reported 48 ships waiting off Savannah.
Georgia Ports Authority Executive Director Griff Lynch said Thursday that “easing of demand should help U.S. ports address vessel backlogs” and that Savannah expects to clear its queue by the end of November.
Lynch said that the number of containers now on the water en route to Savannah is down 22% from July highs. Bookings data on cargo bound for Savannah from FreightWaves SONAR shows a similar drop from July levels.
The second-largest queue in North America is off Houston. As of Friday, there were 17 vessels waiting, down from the mid-20s last month.
Elsewhere off East and Gulf coast ports, there were 14 container ships waiting for berths at the Port of New York and New Jersey, seven off the coast of Virginia, two off Florida, two off New Orleans and one off Charleston, South Carolina.
West Coast ship queues
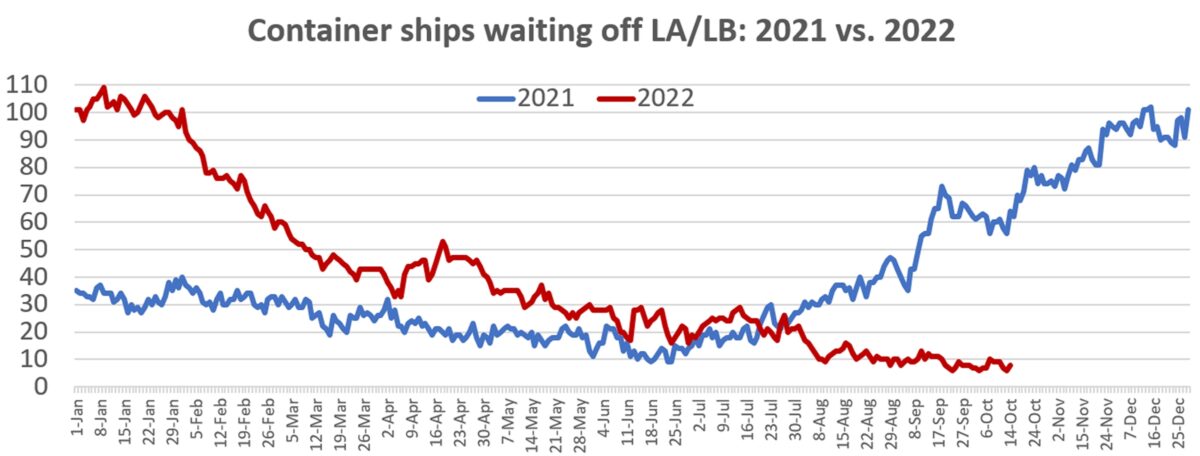
Meanwhile, the ship backlog off the West Coast continues to dwindle.
There were eight container vessels in the queue off Los Angeles/Long Beach. On Thursday, there were only six, tying the record low hit three times previously in the past three weeks. Los Angeles/Long Beach used to be the epicenter of the container-ship traffic jam, with a peak of 109 vessels waiting on Jan. 9.
There were 13 ships waiting for berths in Oakland, California, on Friday. The queue off Vancouver, British Columbia, was down to six, with none waiting off Seattle/Tacoma.
Imports, queues and spot rates
Assuming U.S. imports continue to fall month on month, ports should continue to bring down ship backlogs through the remainder of the year.
Data from Descartes and Panjiva showed that U.S. imports fell 12% in September versus August. Data from PIERS showed an 8.2% month-on-month decline.
As port queues wind down, vessel capacity that had been tied up waiting is released into the market. This increases effective vessel capacity and the number of slots available for cargo. To the extent this is not offset by carriers “blanking” (canceling) sailings or suspending services, declining port congestion creates downward pressure on spot rates.
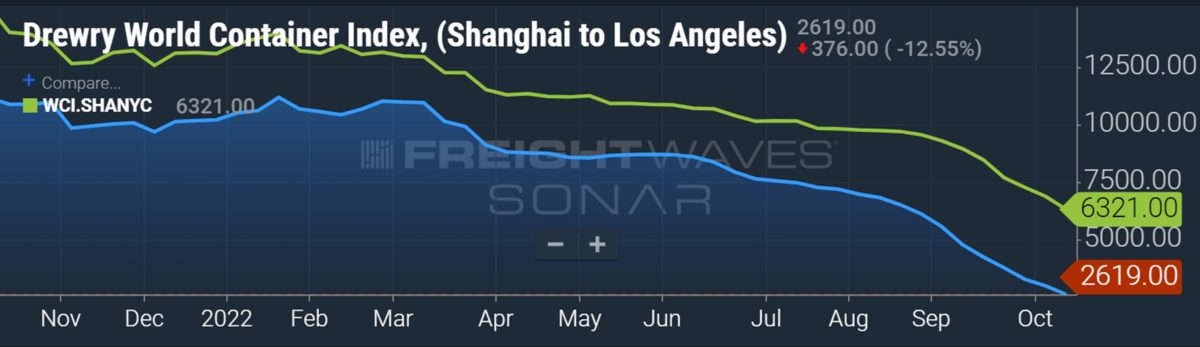
Over the past week, Drewry’s index for Shanghai-Los Angeles spot rates fell another 13% to $2,619 per forty-foot equivalent unit. Its Shanghai-New York index declined 8% to $6,321 per FEU.
Rates have held up better on the East Coast trans-Pacific route, where port congestion has supported pricing to a greater extent than on the West Coast route. Drewry’s Shanghai-Los Angeles index is down 76% year on year, while its Shanghai-New York index is down 55%.
Click for more articles by Greg Miller
Related articles:
- US imports sink in September, suffer steepest drop since 2020 lockdowns
- Tidal wave of new container ships: 2023-24 deliveries to break record
- Shipping giant Maersk: ‘Significantly less demand’ but ‘no hard landing’
- If supply chain crunch is finally easing, why is inflation so high?
- Container shipping lines suddenly a lot less interested in renting ships
- Fall in container spot rates ‘much steeper,’ ‘less orderly’ than expected
- West Coast ports sink to lowest share of US imports since early 1980s
