


The cost of running empty just went up again. Nonrevenue, or empty miles, are nothing new. Carriers don’t get paid when they’re not loaded. While the cost bucket was up alongside fuel prices last year, it’s already up significantly in 2022.
Carriers have fuel surcharges (FSCs) in place to cover fluctuations in diesel prices for paid miles. However, they don’t cover deadhead, out-of-route miles or idle time. That means as fuel prices increase, so do the costs associated with running empty.
FSCs only stretch so far
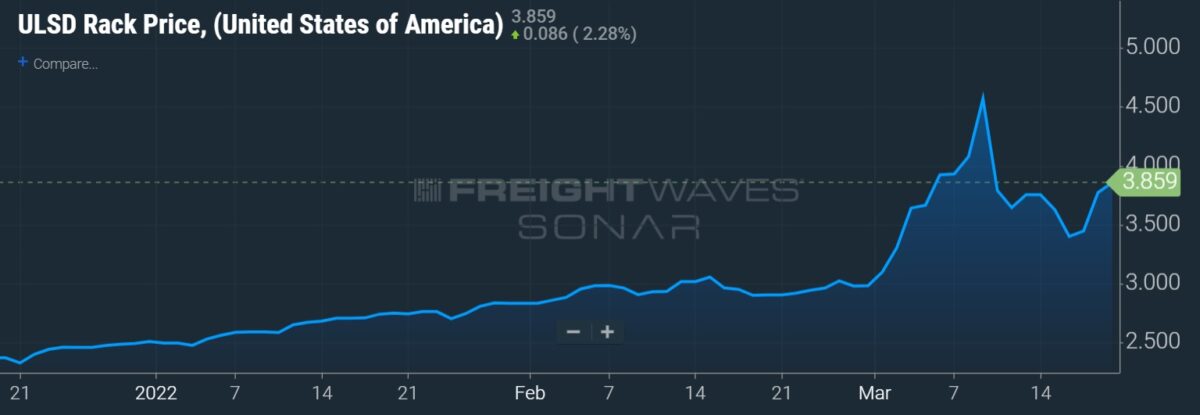
At $5.25 per gallon, the latest week marked one of diesel fuel’s largest one-week jumps on record. The week preceding it was the highest dating back to 1994, according to the Department of Energy’s statistics and analysis agency.
Diesel’s recent ascent dates back to the end of 2020. The average weekly price increased 30% year-over-year for all of 2021 (up 37% from the beginning to the end of the year). Heading into Russia’s invasion of Ukraine, prices were up nearly 40% year-over-year to start 2022.
Large carriers have FSC programs in place to capture the volatility in prices. Most carriers set FSCs weekly based on the DOE’s on-highway retail price published on Monday. This means there is a weekly lag in the mechanism where carriers have to eat the increase when prices continue to rise throughout the week but benefit when they fall.
Steadily rising prices can strain carrier cash flows until prices moderate and FSC programs have time to catch up.
Some large carriers have above- and below-ground fuel storage tanks at their terminals, buying fuel in advance, sometimes opportunistically, which can provide a bit of a hedge. Also, the big carriers can buy at prices closer to wholesale rates, another buffer to fuel costs as FSCs are established on retail prices. However, most public fleets don’t directly engage in derivatives or hedging practices as a tool of mitigating volatility.
There is no offsetting revenue stream for deadhead. Empty miles are more expensive as diesel prices have soared and carriers can’t immediately go back and renegotiate contracts to adjust for the increases.
The incremental cost of empty miles could increase roughly $2,000 to $3,000 per tractor year-over-year in 2022 on higher diesel prices alone. The math assumes diesel prices stay level and that deadhead and fuel consumption metrics hover around industry averages.
Large fleets wouldn’t see as big of a headwind due to fuel purchasing power and better mileage economics. They often run younger equipment and have more advanced fuel economy programs.
But smaller carriers will likely struggle, left recouping the higher expense through rate increases, assuming the market cooperates. Smaller operators buy exclusively at the pump using preferred rewards and perks programs. The premium they pay for fuel could be more difficult to account for in their pricing models while at the same time trying to remain competitive.
Carriers have been successful offsetting higher wages and insurance costs, and more recently higher maintenance expenses due to equipment delivery delays, through rate increases. Higher empty miles expense is one more hurdle that will have to be navigated in the everything-costs-more economy.
Carriers won’t likely absorb a $3,000 per-tractor cost hike on empty miles this year as they make adjustments to capture the increases through rate negotiations and other means. The real concern is the impact that $5 fuel ($4-plus gas) has on the economy on top of 8% annualized inflation (10% at the wholesale level). How quickly does the consumer, which had a historically pristine balance sheet mid-COVID, tap out and stop buying?
Elevated fuel costs likely to stick around
The fuel situation may be easing, at least temporarily, as Brent crude futures, the global benchmark, have pulled back to $108 per barrel from an intraday price of more than $130 in early March.
Wholesale diesel prices, which are highly correlated with futures prices, have been declining in recent days as well. Russian oil is still leaking through to the market even with official and unofficial embargoes in place. And China’s zero-COVID policy, prompting sporadic lockdowns wherein commerce ceases, is believed to be supportive of supply. Also, there has been chatter that the U.S. may lift sanctions on Venezuelan oil.
However, the fuel risk is unlikely to go away anytime soon and that means carriers have another expense item to offset.
Oil producers don’t want to invest in an inflationary environment and many remain concerned about the Biden administration’s fossil fuels policy, even though the White House has called for short-term production increases recently.
Producers are targeting only mid-single-digit growth moving forward. They are in no hurry to put fresh capital in the ground as they see no resale market for the assets if the fossil fuel phase out continues (global oil and gas capex was $100 billion lower in 2021 than the $450 billion level recorded in 2019).
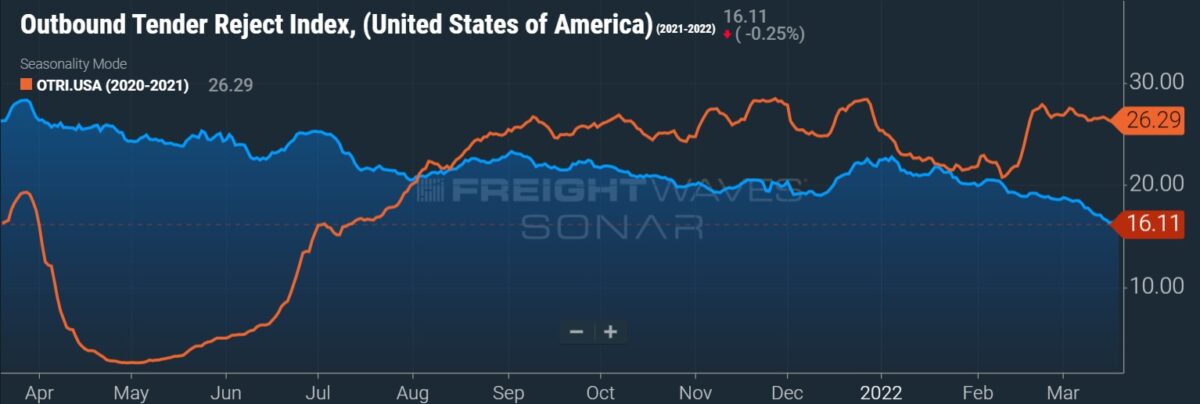
TL market loosening, spot rates retreat while fuel surges
Tender rejections have been declining all year but the step lower in recent days has bucked normal seasonal trends.
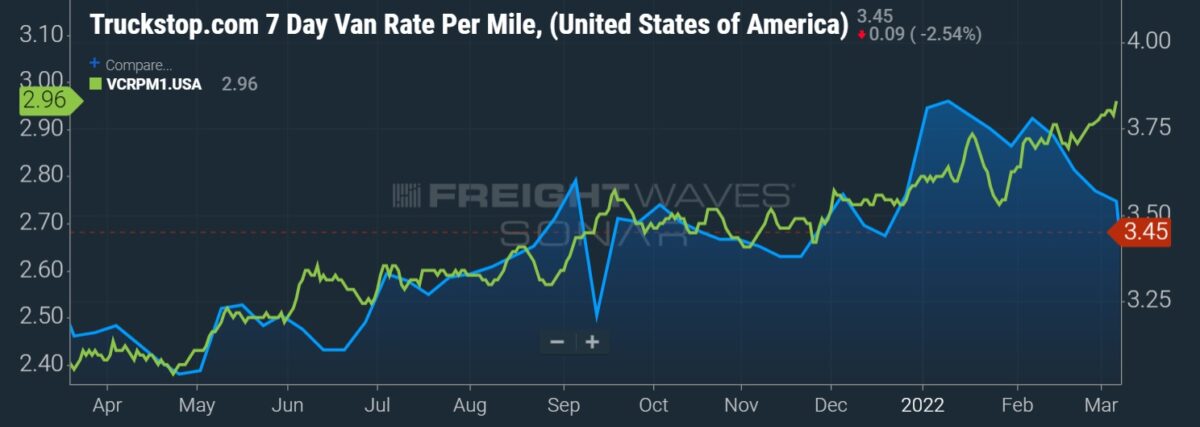
The recent surge on the fuel line comes at a time when spot rates, which include fuel surcharges, are receding, meaning the move in spot rates is actually more deflationary than the absolute percentage decline suggests. Spot rates normally capture spikes in diesel prices but that doesn’t appear to be occurring as capacity has loosened and rates have fallen.
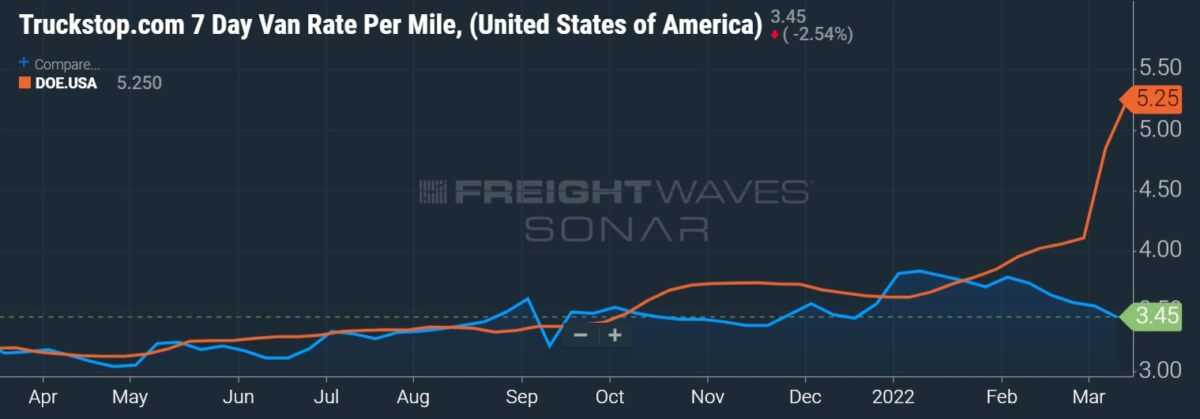
Morgan Stanley (NYSE: MS) is calling for spot rates to decline by 10% in the next six months and by 17% within a year, exclusive of changes in fuel. However, contract rates, which lag spot rates, are still stepping higher.
Soaring fuel prices have thrown a curveball at what was already expected to be a year of receding fundamentals for the TL industry as incremental capacity seeped in and demand cooled as inventories were replenished. Spot rates were expected to decline in the back half of the year to reflect these trends. Fuel volatility may have accelerated the easing cycle as the current economics are forcing shippers to further scrutinize each load with carriers left scrambling to recoup elevated deadhead costs.
Click for more FreightWaves articles by Todd Maiden.
- J.B. Hunt to expand intermodal container fleet by 40%
- A. Duie Pyle expands LTL network into Virginia
- Shipments rebound in February, costs at record levels
