


Statista reported the final mile delivery market to be $31.25 billion in 2018. XPO Logistics noted a $13 billion heavy-goods segment in its third quarter 2019 shareholder report, and SJ Consulting estimated it at $8.1 billion in 2017. McKinsey & Co. reported half of UPS’ $35 billion in parcel deliveries were e-commerce direct-to-customer orders, and A.T. Kearney reported that up to $65 billion was spent on picking, packing and last-mile delivery in 2016. Most estimates forecast compound annual growth rates north of 12% and project significant growth well past 2025.
The Bureau of Economic Analysis (BEA) reports that the last leg of overall transportation costs make up as much as 28% of logistics expenses. Transportation’s contribution to the economy can be measured by its contribution to gross domestic product (GDP). The Bureau of Transportation Statistics reports the final (finished) transportation goods and services purchased by people, businesses and governments in 2018 contributed $1,489.7 billion, or 8.9%, to U.S. GDP. If we apply the aforementioned 28% BEA figure, we could say the market for final mile (from a GDP perspective) is an astounding $417 billion. In this short list of examples, estimates for the U.S. final mile range from $8 billion to $417 billion.
Why is there such a wide range in final mile market size estimates?
Estimates are a combination of hard data and expert opinion, which roughly judge the value, number, quantity and extent of the market. The term “final mile” is broadly used to describe the movement of people and products the last leg of transportation from a facility to a final destination, and some estimates include all modes transporting products, commodities, mail and people to both residential (B2C) and business (B2B) premises. Others focus on the store-to-home transportation of very specific goods. Estimates can be limited to goods sold within the U.S. or include cross-border sales with domestic delivery. To account for drop-ship and other forms of e-commerce fulfillment, some estimates include first-mile, middle-mile and fulfillment costs in a first-to-last-mile approach. Unfortunately, no matter the scope of transportation services included, most of the data upon which final mile estimates are based must be triangulated – which is a scientific way of saying that estimates are estimated.
The U.S. Department of Transportation estimates 50% of transportation is in-house (e.g., goods moved by trucks owned and or operated by a firm for its purposes). As a result, the data related to order volume and pricing included for final mile product delivery is mostly proprietary. If the data is not private, it’s often embedded as part of other transportation modes, making it difficult to extract. So a mix of government and industry data, secondary sources and expert opinions must formulate a best guess, which makes the precise market definition, data, resources and triangulation methods used to produce a final mile market-segmentation report critical to the result you seek.
Given the absence of hard data and more clearly defined “official” final mile market segments, the evolving shift from retail to consumer direct delivery and emerging technical innovations like 3-D printing, drone and autonomous vehicle delivery promise to further complicate results.
Why isn’t final mile a transportation mode?
Wikipedia tells us that a mode of transport is “a term used to distinguish between different ways of transportation or transporting people or goods. The different modes of transport are air, water and land transport, which includes rails or railways, road and off-road transport.” Absent its own mode, final mile could be thought of as a service optionally applied to other modes. Like the first-mile, final mile represents a functional step in transportation, which may or may not be executed by a specialist and may or may not be included as part of a broader bill of lading. Every shipment has a beginning and an ending, a pickup and delivery, a shipper and consignee, and unfortunately for our market-sizing experts, every mode has a final mile.
Now, not to blame the problem on the dictionary, regulators or deregulation, it is worth noting, following the dissolution of the Interstate Commerce Commission (ICC) in 1995 (the same year Amazon launched), there has been no official independent agency of the U.S. government regulating the economics, service definitions and specifications for carriers engaged in interstate transportation. There also are no agencies consistent among states similarly regulating intrastate transportation from which both an official definition of final mile and the data-related economic impacts can be surmised.
Why include everything under one final mile segment?
Consider the U.S. Postal Service (USPS) for example. It has a monopoly on the snail-mail final mile segment. Inclusive of parcels, its operating revenues for 2018 were $70.6 billion. But what part of that revenue (excluding parcels) represents the final mile portion of snail-mail delivery? Is it actually addressable by a competitor? Should it be included in final mile market-segmentation reports?
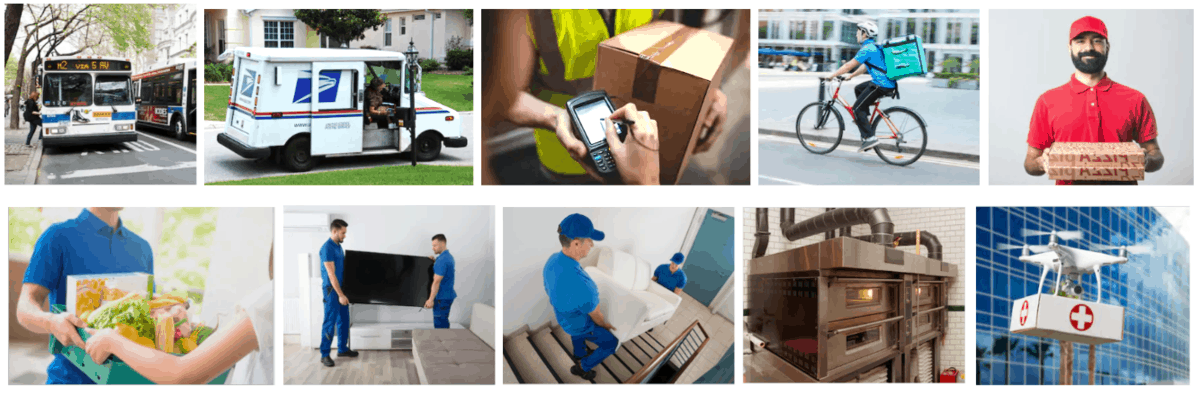
To illustrate the challenge further, consider the question, “Should we expect our favorite carrier to deliver pizza and pizza ovens with the same vehicle, on the same route, with the same driver?” It seems clear that pizza and pizza ovens should be placed in separate final mile vehicles, even if included under the same ubiquitous final mile umbrella.
We can illustrate the final mile market segment conundrum with other product examples like medicine and MRI machines, auto parts and automobiles, and lumber and furniture. Given the wide range of products, vehicles and skills that can be associated with delivery, and the fact that most of the data related to transportation is proprietary or embedded as part of other transportation services, it’s no wonder why there are such wide-ranging estimates – and why there is no single carrier servicing every type of final mile order.
How would one go about sub-segmenting final mile?
To identify sub-segments, we’d have to consider the industry, supply chain, commerce channel, type of cargo, mode of transport, type of delivery vehicle and delivery services required, along with the requisite labor, tools and skills needed to execute delivery (and possible setup or installation of the goods). Then we have to determine to what extent the sub-segment is addressable.
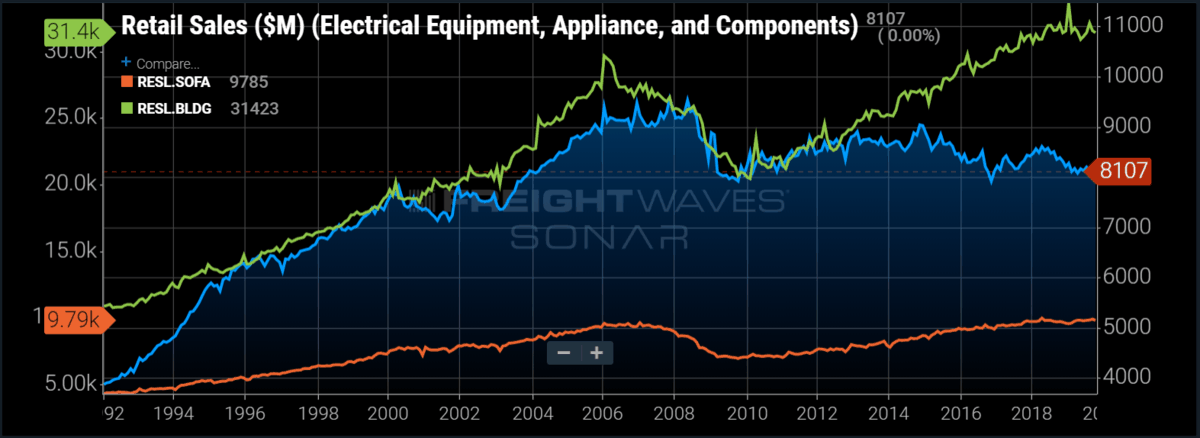
Initially, the final mile can be segmented into three main categories of passengers, light goods and heavy goods. Each can be serviced with a variety of vehicle types and require varying levels of service, which implies they can be further divided into a yet undetermined number of sub-segments. Under the segment we call heavy goods, we find products like building materials and garden equipment (RESL.BLDG), furniture (RESL.SOFA) and televisions (RESL.ELEC).
If we dig deeper, we recognize that these heavy goods can be sub-segmented further by delivery vehicle, driver and helper requirements, driver and helper skills, delivery site attributes, transit time and a myriad of other attributes. The skills and equipment needed to deliver a sofa are much different than those needed to deliver and install a home theater. Surely, a skid of drywall or pavers would not be delivered to a job site on the same type of equipment used for furniture delivery.
Final mile segments and SONAR
Certainly, before railroads began, there was no need to define rail as a mode. CompuServe was founded in 1969 and Amazon started shipping in 1995, so maybe it’s about time to examine the final mile further. To be clear, it is not the purpose of this article to sub-segment the final mile market but to illustrate why market size estimates vary so widely between reputable sources.
Absent other “official” efforts to define and standardize sub-segments in the final mile space, FreightWaves is exploring use cases, final mile benchmarking initiatives and developing new data resources of actionable interest and value for final mile as it relates to the diverse and ever-changing interests of shippers, brokers, carriers and consumers. Please stay tuned!
Robert DeDomenico
What do you call a last mile delivery ‘machine’? A utility system! Water. Power. Fuel. Information. All delivered… ALL THE WAY! Reverse logistics? SEWER!
Utilities are the BEST AT THE LAST MILE!
A utility for parcel could dominate…
and kick off a revolution in delivery and transportation.
I am a USN submariner vet, a nuclear professional, and a dedicated transportation research and developer, and probably ten years ahead of any other entity. What I develop will save energy, money, and lives. Investigate and you will come to agree.