


Researchers at the New York Federal Reserve have a new way to measure the logistics chaos that’s being partially blamed for consumer price inflation: the Global Supply Chain Pressure Index (GSCPI).
The new measure aggregates 27 indicators — including two shipping indexes, the Baltic Dry Index (BDI) and Harpex index — into a standard deviation from the average since 1997. It’s designed to provide “a more comprehensive summary of potential disruptions affecting global supply chains.”
So, how high is it?
In October and November (the latest two months available), it measured 4.43 and 4.37 standard deviations above average, respectively. To put that in the lingo of financial traders, the current situation is an extremely rare “four sigma” event.
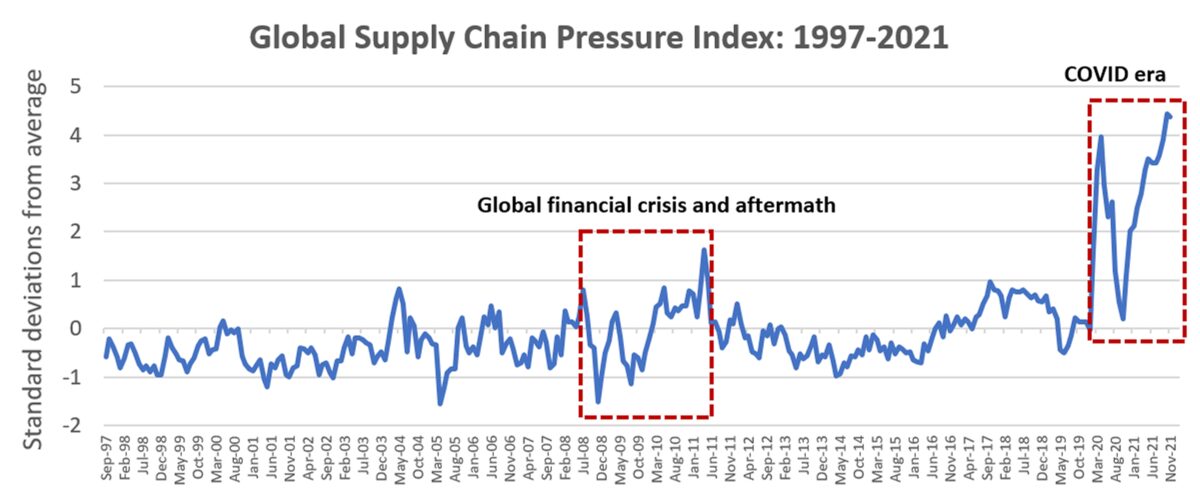
Following the onset of COVID, the GSCPI showed a sharp jump coinciding with the initial lockdowns in China, Europe and the U.S. Then came a second, even larger rise — one that’s still underway — coinciding with the surge in consumer demand.
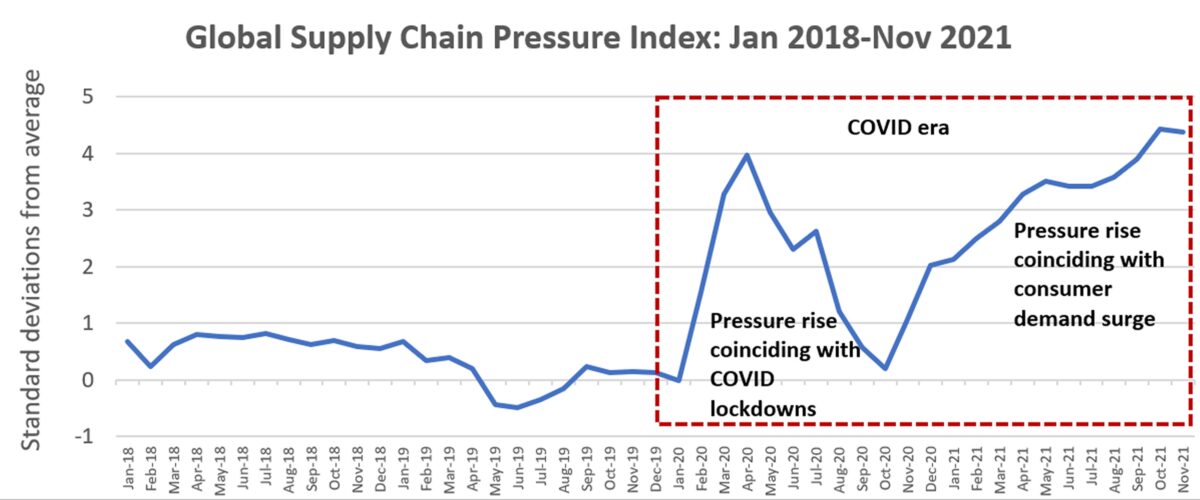
In their introductory post on Tuesday, the New York Fed researchers stated that “more recently, the GSCPI seems to suggest that the global supply chain pressures, while still historically high, have peaked and might start to moderate somewhat going forward.” Stories on the new index by Reuters, CNBC and Business Insider highlighted the “potential peak” angle in their headlines.
American Shipper asked the Fed researchers about the evidence of moderation. They responded that the evidence is the index decline in November versus October.
But the index decreased just 1.4% in November from October, after rising 2,115% between October 2020 and October 2021. And over the time span covered by the GSCPI, there have been many instances when the index fell by 1.4% or more in one month and then continued to rise thereafter, most recently in June (complete index dataset here).
Index components
The GSCPI is “built on variables that are meant to capture factors that put pressure on the global supply chain,” wrote the authors at the New York Fed: Gianluca Benigno and Julian di Giovanni, assistant VPs of research and statistics; officer Jan Groen; and senior research analyst Adam Noble.
In addition to the BDI and Harpex, there are four other transportation inputs to the GSCPI: U.S. Bureau of Labor Statistics price indices on airfreight costs for Asia-U.S., U.S.-Asia, Europe-U.S. and U.S.-Europe.
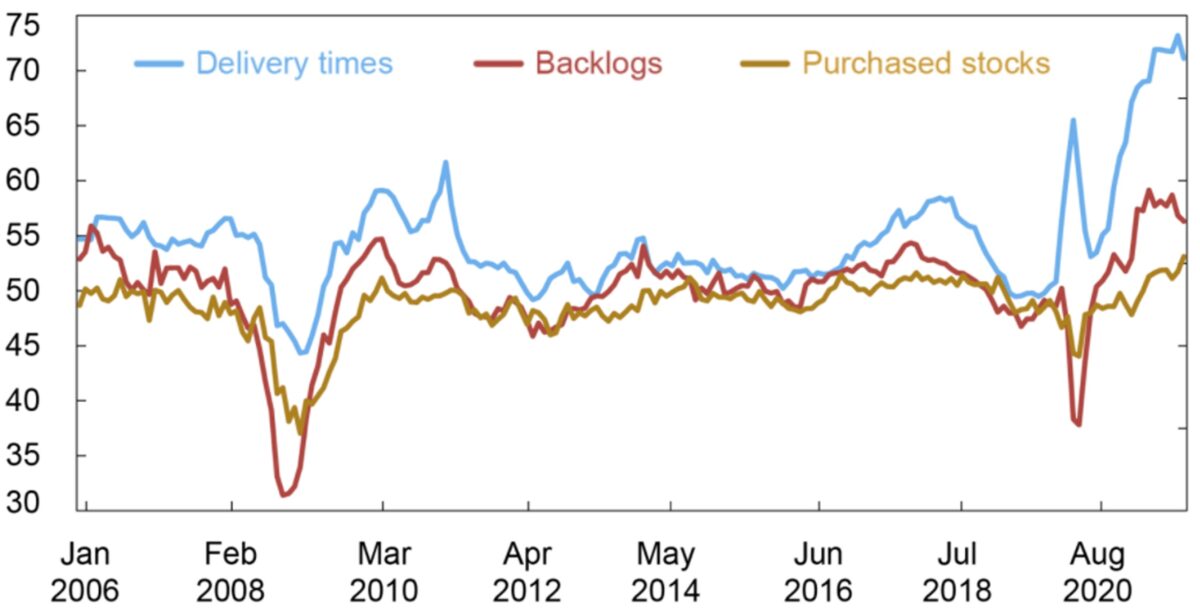
The other 21 components are Purchasing Managers Index (PMI) surveys for three subcomponents — delivery times, backlogs and purchased stocks — for seven economies (euro area, China, Japan, South Korea, Taiwan, U.K., U.S.).
Why BDI and Harpex?
For ocean shipping insiders, the inclusion of the BDI and the Harpex might seem a curious choice.
The BDI tracks ton-mile demand for dry bulk commodities — mainly iron ore, coal and grains — in relation to the supply of bulk carriers near loading ports. Congestion does play a role in effective ship supply, particularly so in 2021 due to strict COVID protocols at Chinese import terminals. But over-ordering of bulker newbuilds relative to demand, far more so than congestion, drove the BDI during the decade prior to COVID.
The Harpex measures the rates liners pay to charter ships, not what cargo shippers pay to transport cargo. Supply chain congestion severely curtailed effective ship supply in 2021, increasing ocean carrier demand for charterable vessels and boosting charter rates to record highs. But in the decade prior to COVID, container-ship charter rates were dictated by excess newbuild deliveries relative to demand, not port congestion.
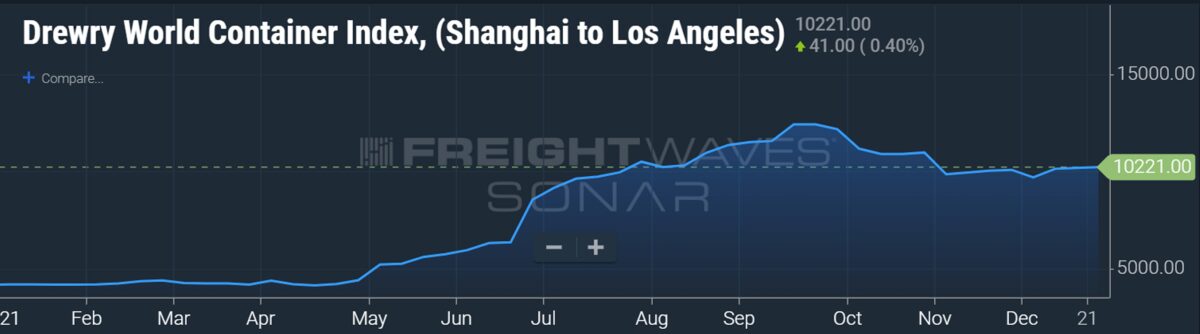
Asked by American Shipper why the Harpex was used as opposed to a spot freight rate index like the Drewry World Container Index, the New York Fed researchers said that “Harpex was chosen because a longer sample was available. We only have access to Drewry over the last couple of years.” (The Harpex index goes back to 2001, only five years longer than Drewry’s World Container Index, which has been published since 2006.)
Asked about the inclusion of the BDI, the researchers responded that it was chosen “based on data availability.”
The GSCPI is generated using principal component analysis after all 27 components are adjusted in an effort to “purge demand factors” and “isolate supply side drivers.” Asked how the GSCPI weighs the various components, the authors explained that the BDI weighting is 0.02 and the Harpex 0.09. “To put this in perspective, the weights of the country-specific delivery times are in the 0.30-0.35 range. As such, the BDI has the smallest weight out of the 27 variables that go into the index and the Harpex is in the bottom four.”
Indeed, a chart released by the New York Fed researchers of the PMI subcomponents, weighted by GDP, reveals the importance of the delivery time indicators, which measure how supply chain delays impact producers.
The GDP-weighted delivery times index (the blue line in the chart below) appears to most closely track the overall path of the GSCPI during the COVID era — including a big decline around mid-2020 as the effect of initial lockdowns on delivery time reversed — a pattern that significantly diverged from freight rates.
Index peak or head fake?
Container freight rates appeared to be peaking in September-October, but they didn’t fall far before plateauing, and over the past two months, they started rising back up again. Likewise, the Harpex charter rate index has risen since November.
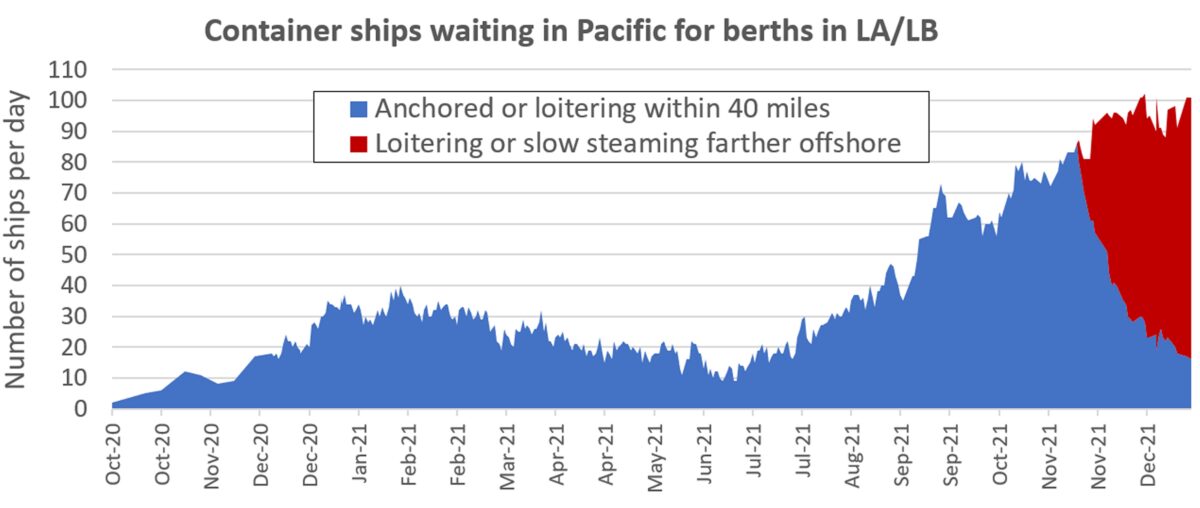
Another indicator — the number of container ships waiting for berths in Los Angeles/Long Beach — has been rising inexorably since mid-June. As of Tuesday, there were 101 container ships waiting in the Pacific, very close to the all-time high.
As to the question of whether the GSCPI has actually peaked, as the New York Fed researchers suggest, or whether it’s a head fake — as the earlier dips in freight and charter rates turned out to be — the release day for the December index has yet to be determined, but updates will be published monthly.
Click for more articles by Greg Miller
Related articles:
- 2021’s top shipping stories: From Ever Given to epic California port pileup
- By the numbers: Shipping’s unparalleled year in 10 charts
- About that rate relief … ocean shipping costs are rising again
- Los Angeles import volume sinks as shipping traffic jam worsens
- It’s official: 96 container ships are waiting to dock at SoCal ports
Ken Snead
The Federal Gov. Rules and Insurance companies, are to blame.