


Chart of the Week: National Trucking Index, Outbound Tender Reject Index – USA SONAR: NTI.USA, OTRI.USA
National truckload spot rates increased a marginal 1.5% over the past week, according to the National Truckload Index (NTI), as the first hurricane to make landfall in the U.S. this year hit the southwest coast of Florida. Similarly, national tender rejection rates seemed unaffected, indicating transportation managers have little to fear in terms of capacity availability on a national level.
Natural disasters like Hurricane Ian can send transportation markets spiraling, seemingly in environments that have plenty of capacity. Relief supplies like bottled water, food and power generators are shipped into disaster zones, gobbling up truckload capacity. These loads tend to pay a premium and pull trucks off existing routes, but carriers should educate themselves before taking on this unique and honorable challenge.
Contributing to the capacity problem, production in disaster areas can stall and thoroughfares can be blocked, leading to backlogs and congestion.
There is nuance to every hurricane and its subsequent fallout. Ian is missing a few critical components to make it a serious threat to transportation capacity.
There are three main factors that tell us whether a hurricane or other natural disaster is going to have a strong national impact on domestic transportation:
- Timing/market conditions — is the market stable/transitioning and tight/loose?
- Location — urban areas are at risk for more damage, but is the location also a primary hub for production or transportation?
- Amount of damage — this has more of a long-term impact and is less impactful to transportation at the time of the event.
Timing is nearly everything
Market conditions are probably the most understated of all major factors of whether a disaster disrupts supply chains by inhibiting the flow of freight. Whether a market has a cushion of capacity or not makes all the difference.
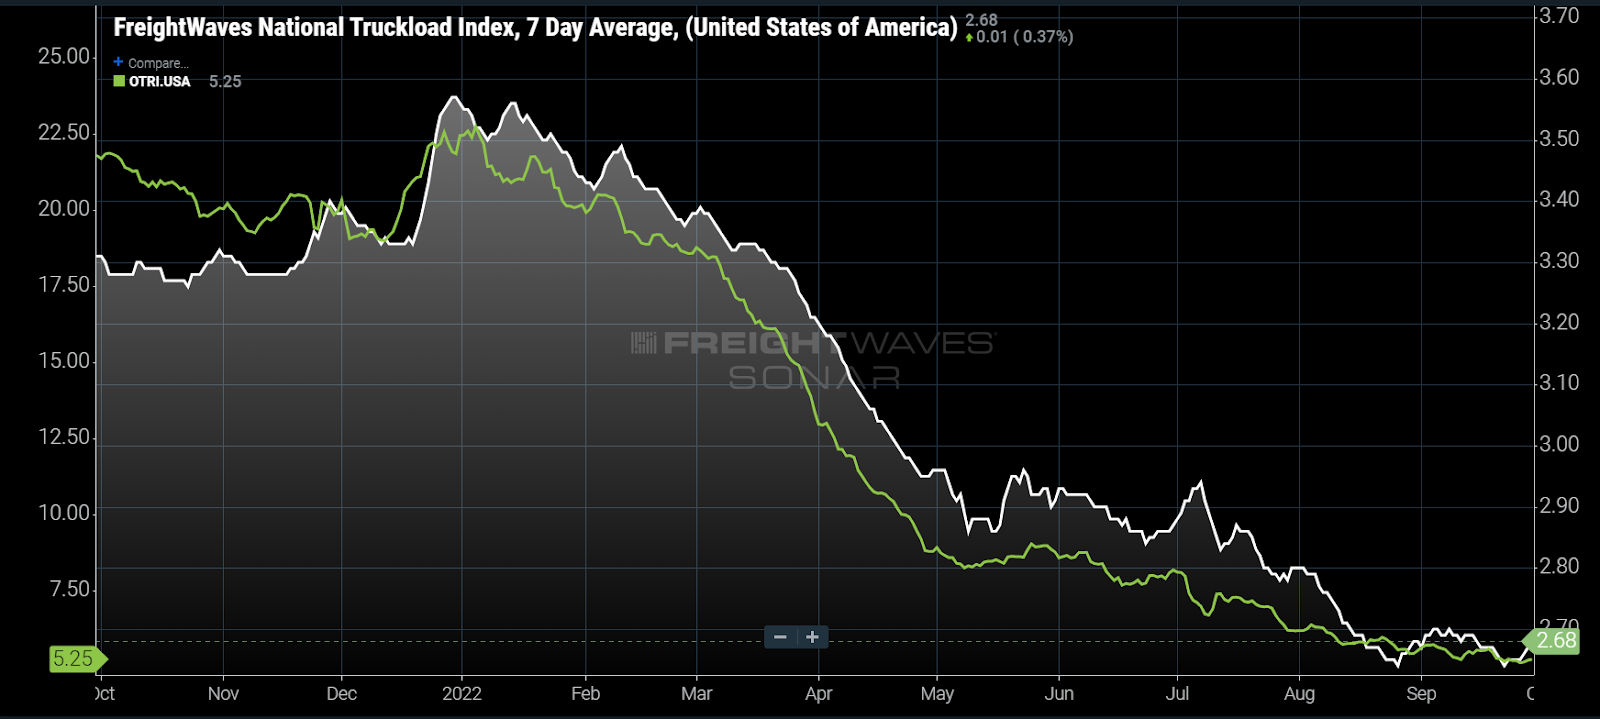
Truckload demand has been in decline since February and subsequently spot rates have fallen from record levels since then. The NTI, which measures dry van truckload spot rates, has dropped 24% since Jan. 13 — the bulk of that drop occurring from March to May. Waning consumption and inventory gluts from over-ordering are largely to blame.
When capacity exceeds demand, spot rates will fall. The magnitude of this year’s decline indicates that supply of capacity is well above demand, meaning that there are a lot of trucks looking for something to haul at the moment.
National tender rejection rates (OTRI), a measure of carrier willingness and availability to cover contract freight, are at 5.25% after averaging above 20% through all of 2021. To put it another way, carriers are gobbling up 95% of all capacity requests — the highest acceptance rate since April 2020. The freight market is not just loose but still transitioning from historic tightness.
Location, location, location
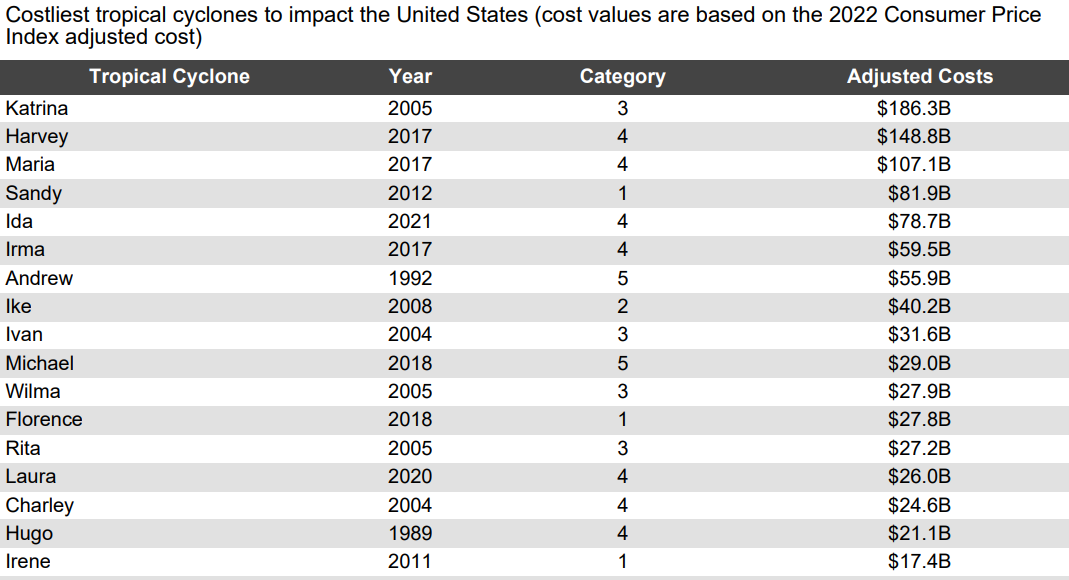
Hurricane Harvey hit as a Category 4 hurricane — the same as Ian — just over five years ago just to the south of one of the nation’s largest outbound freight markets of Houston. Harvey is considered the second costliest hurricane in history and contributed to triggering one of the tightest freight markets of the modern era.
Hurricane Irma made landfall as a Category 3 storm in Florida a few weeks after Harvey but did not have as strong of an impact on freight flow in the U.S. due to hitting what was and is essentially an island for population and production. Ian hit just a few miles north of where Irma did.
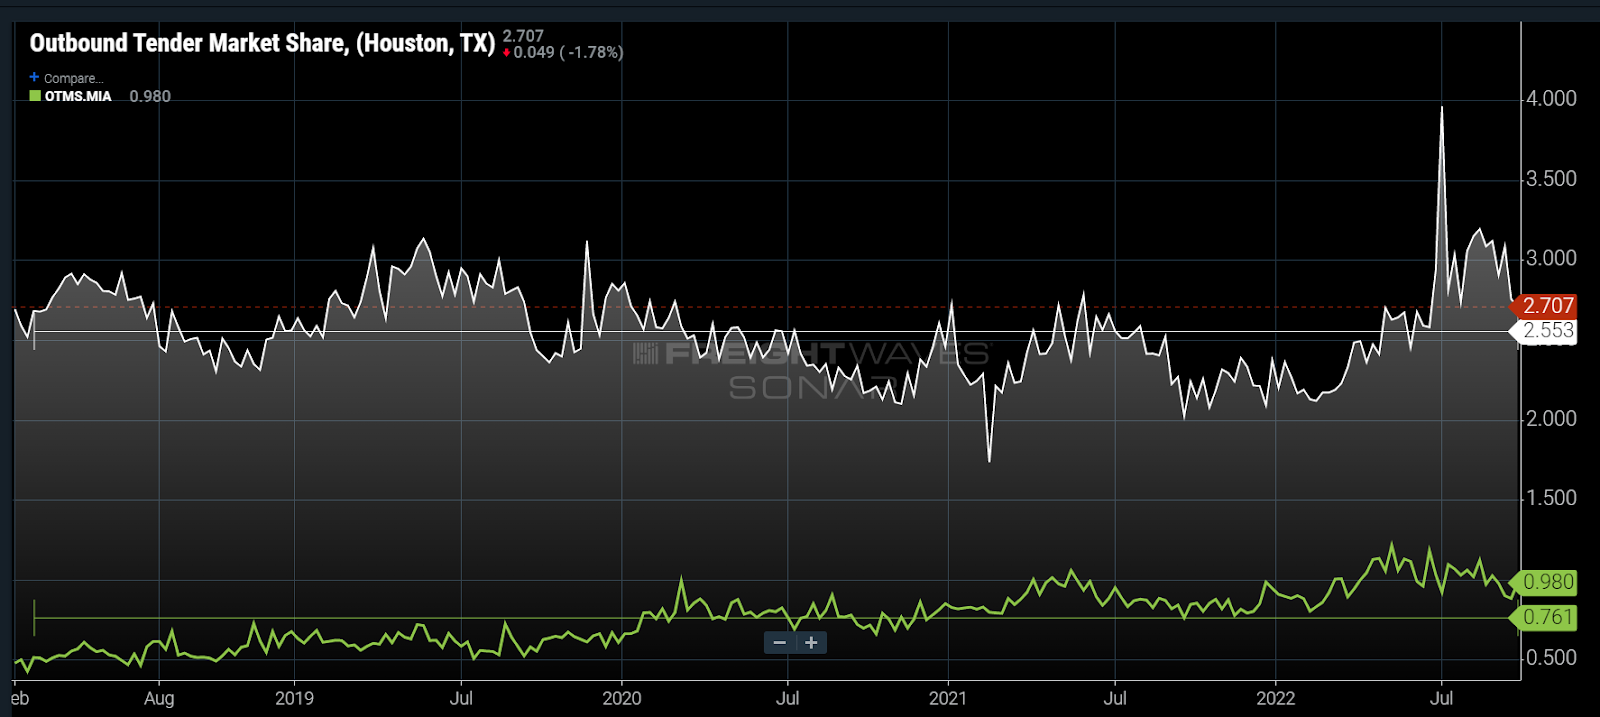
The Houston market is also a freight production hub and accounts for roughly 2.5% of total truckload demand in the U.S. since 2017. The Miami market — where Irma and Ian made landfall — averages three times less. Basically, south Florida is not a heavy production center and is positioned out of the way of any major thoroughfares for trucks.
Sticker shock
The total cost gets all the attention but it is difficult to tie total economic damage from a storm to transportation markets. Much of the damage is not repaired right away and it can take years to recover. Looking at Google maps of the Lake Charles, Louisiana, area, you can still see blue tarps on houses from Laura in 2020 where repairs have still not been completed.
Dollar values act more as a barometer for potential than actual disruption as the impact can be spread over a longer time frame.
In the case of Hurricane Harvey, shipping operations stalled for days while flooding inhibited production. In 2021, freezing temperatures had a similar effect as the Texas power grid failed and infrastructure was frozen.
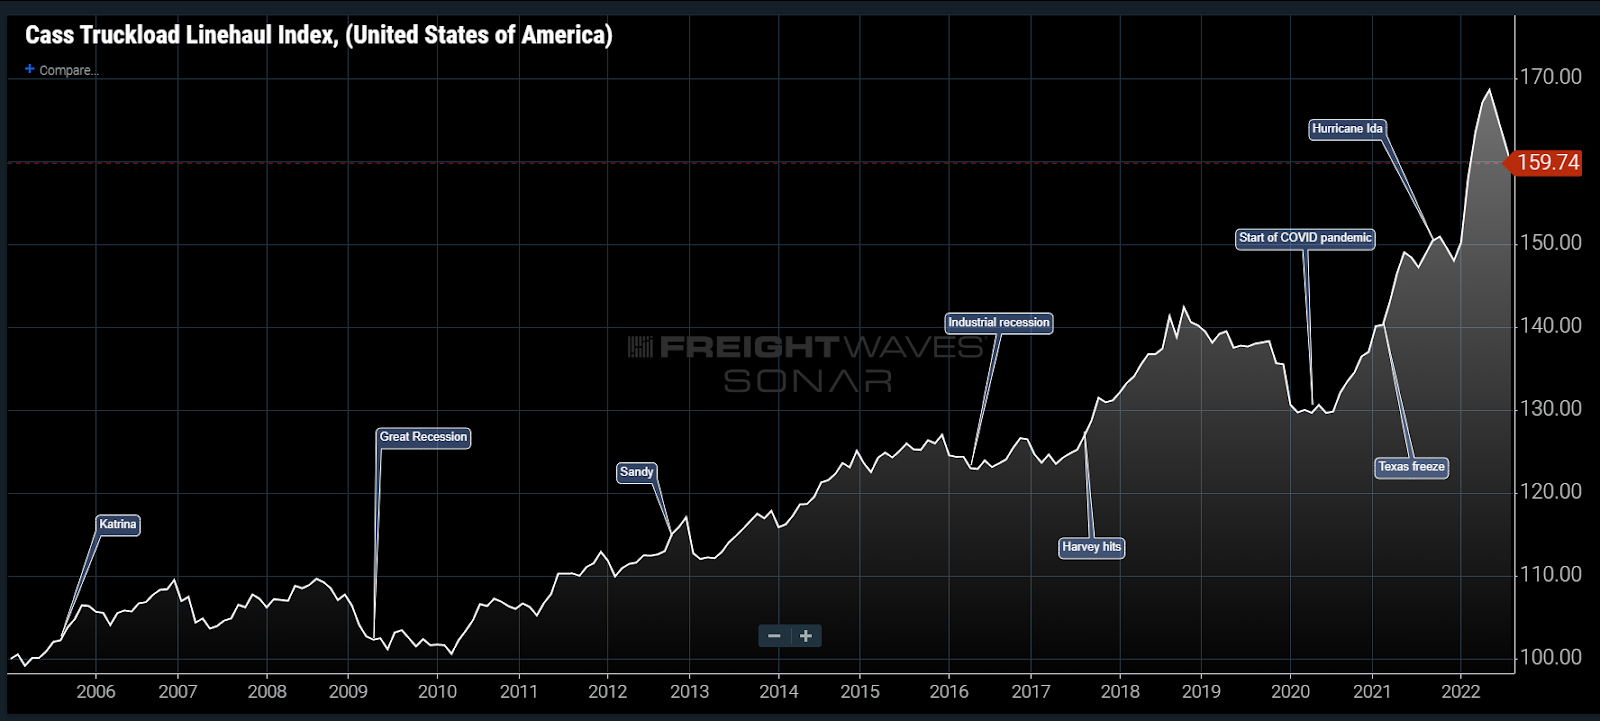
Looking at the Cass Truckload Linehaul Index, which measures base truckload cost fluctuations on a monthly cadence, you can see how timing plays one of the more critical roles in disasters having a strong impact. There have been few disaster events that hit at a time when the market was cooling, making Ian a relatively unique study.
Harvey hit during a trucking market that had been soft for a long period of time, removing capacity and making it more reactive to demand shocks. Ian is hitting early enough in the downturn to have a supply buffer. It is also hitting an area that has little production and is positioned out of the way of most of the heavy traffic.
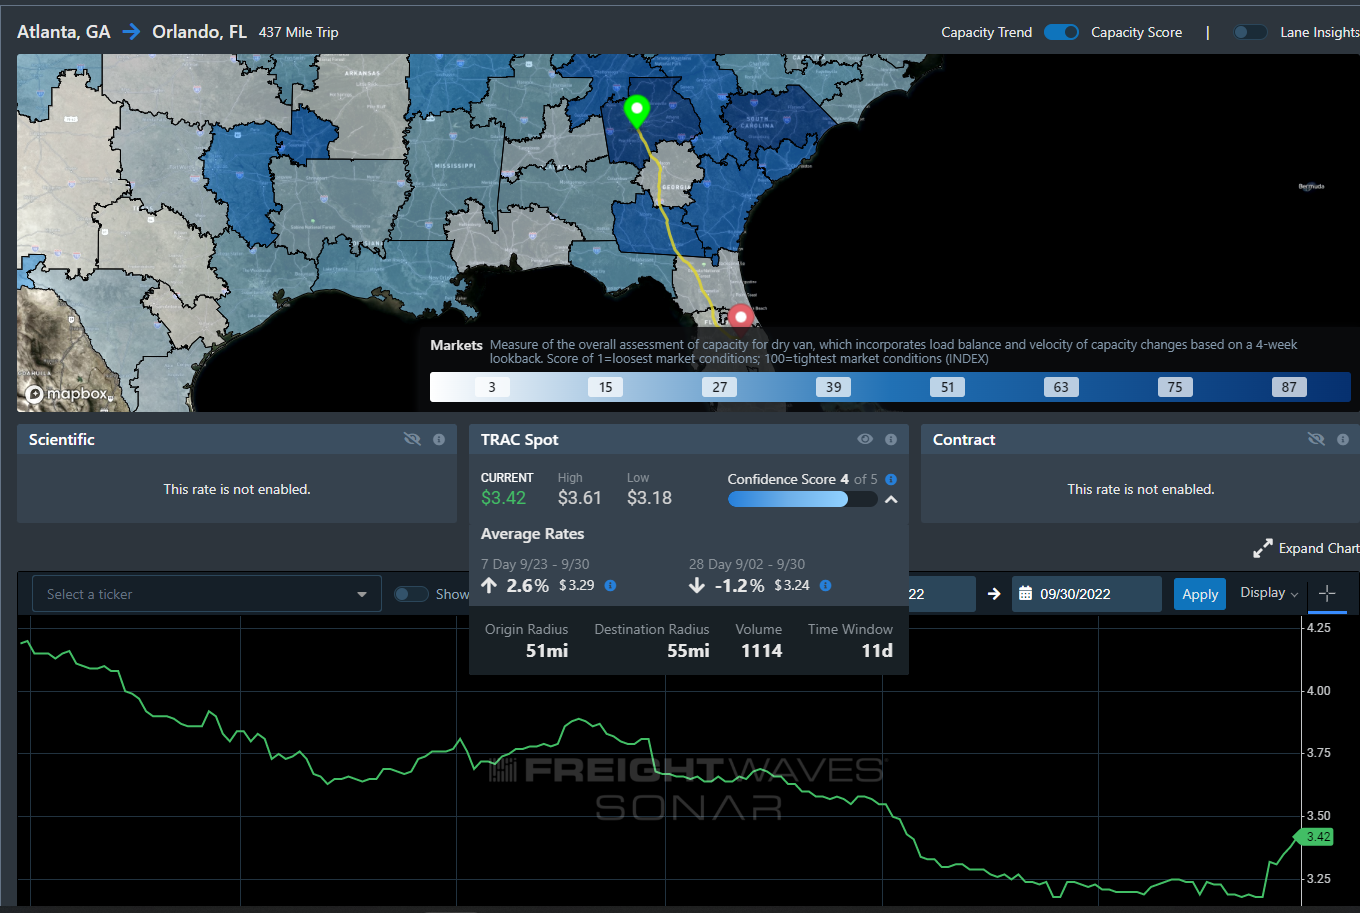
Some regional disruption has been felt as spot rates from Atlanta to Orlando, Florida, are up 2.6% over the past week, according to FreightWaves TRAC. But rates moving in other directions out of Atlanta have not shown any significant movement.
While the numbers on Ian’s total damage won’t be finalized for months, they are bound to make the above list. For the time being, it appears this market has plenty to cushion Ian’s initial blows.
It should be noted that the purpose of this article is not to minimize the impacts these storms have on those affected but to illustrate how storms and disasters influence transportation. Anyone who has experienced a disaster zone recovery understands the dollar values are meaningless when looking through the lens of those most heavily affected. Our thoughts and prayers are with everyone hit by Ian this past week.
About the Chart of the Week
The FreightWaves Chart of the Week is a chart selection from SONAR that provides an interesting data point to describe the state of the freight markets. A chart is chosen from thousands of potential charts on SONAR to help participants visualize the freight market in real time. Each week a Market Expert will post a chart, along with commentary, live on the front page. After that, the Chart of the Week will be archived on FreightWaves.com for future reference.
SONAR aggregates data from hundreds of sources, presenting the data in charts and maps and providing commentary on what freight market experts want to know about the industry in real time.
The FreightWaves data science and product teams are releasing new datasets each week and enhancing the client experience.