Image: Jim Allen/FreightWaves
By Zach Strickland, FW Market Expert & Market Analyst
Chart of the Week: Reefer Outbound Tender Volume Index, Dry Van Tender Volume Index – USA SONAR: ROTVI.USA, VOTVI.USA
It’s Halloween week, and that means tens of thousands of pounds of candy have been moving across the country into grocery stores and various retailers in an attempt to raise the children’s (and parent’s) blood sugar levels. What you may not know is that candy is primarily transported in temperature-controlled or ‘reefer’ — slang for refrigerated — trailers. What may come as a surprise is the fact reefer load volumes have dropped 5% versus this time last year and have been averaging over 5% lower than 2018 volumes since April according to FreightWaves Reefer Outbound Tender Volume Index, while dry van volumes are up 3%, signaling a trickier Halloween for reefer carriers.
Reefer trailers are utilized for shipping commodities that need to have some level of environmental control, either from heat or cold. Most of the demand arises from food products such as produce, candy, and beer. There are instances, however, where shippers will opt to ship on dry van where the cost is lower when they think the weather will cooperate. This is a calculated risk, but reefer carriers are in shorter supply than their van counterparts, and their prices can be much higher — especially in the various produce seasons.
Overall freight volumes have been averaging 3%-5% higher YoY since late July, but reefer volumes have been consistently underperforming, at least on the contracted side. The spot market, where shippers go to find carriers when capacity is unavailable or to find occasional discounts when capacity is loose, has been much softer in terms of price versus 2018. As of October 16, the DAT Dry Van Long Haul Freight Rate Index was roughly 12% lower than the same day last year. The index measures average spot rates excluding fuel and other assessorial charges in longer haul lanes in the U.S.
The declining price of dry van loads has contributed to the declining reefer volumes by placing a downward pressure on prices in entire truckload market. Reefer volumes occupy roughly 15% – 20% of truckload freight moving in the U.S. Van dominates the capacity averaging around 70% with flatbed and tankers making up the rest.
When van capacity increases, shippers are enticed to take the cheaper rate, especially as carriers become more desperate for freight to fill their trucks. Some commodities are not as sensitive to temperature variation, but it is not necessarily best practice. For example, van carriers will move freight overnight when temperatures are cooler and more stable for these commodities. Weather forecasts become extremely important when moving temperature sensitive freight without the system as well.
Shippers are taking a risk in these scenarios, as the retailers will fine them if the product is not in the promised condition, meaning the shippers will also be out at least some portion of the revenue for their shipment.
Combine the oversupplied dry van market with a declining food orders in 2019 and the reefer carriers may have had a more difficult run in 2019 than many dry van companies. According to the Census Bureau, non-durable goods orders for food, beverage, and tobacco have been softer than 2019, 1.3% lower this September versus last, part of a flattening to slightly down nine-month trend.
The trade war has hurt the sector as well, with less produce demand from China, but there were several weather events that hurt yields in late 2018 into early 2019. The good news is that this is more than likely a short-lived cycle as weather events and trade wars are temporary (hopefully) and food is still necessary for human survival. The oversupplied trucking market will more than likely take a bit longer to correct.
About the Chart of the Week
The FreightWaves Chart of the Week is a chart selection from SONAR that provides an interesting data point to describe the state of the freight markets. A chart is chosen from thousands of potential charts on SONAR to help participants visualize the freight market in real-time. Each week a Market Expert will post a chart, along with commentary live on the front-page. After that, the Chart of the Week will be archived on FreightWaves.com for future reference.
SONAR aggregates data from hundreds of sources, presenting the data in charts and maps and providing commentary on what freight market experts want to know about the industry in real time.
The FreightWaves data science and product teams are releasing new data sets each week and enhancing the client experience.
To request a SONAR demo click here.
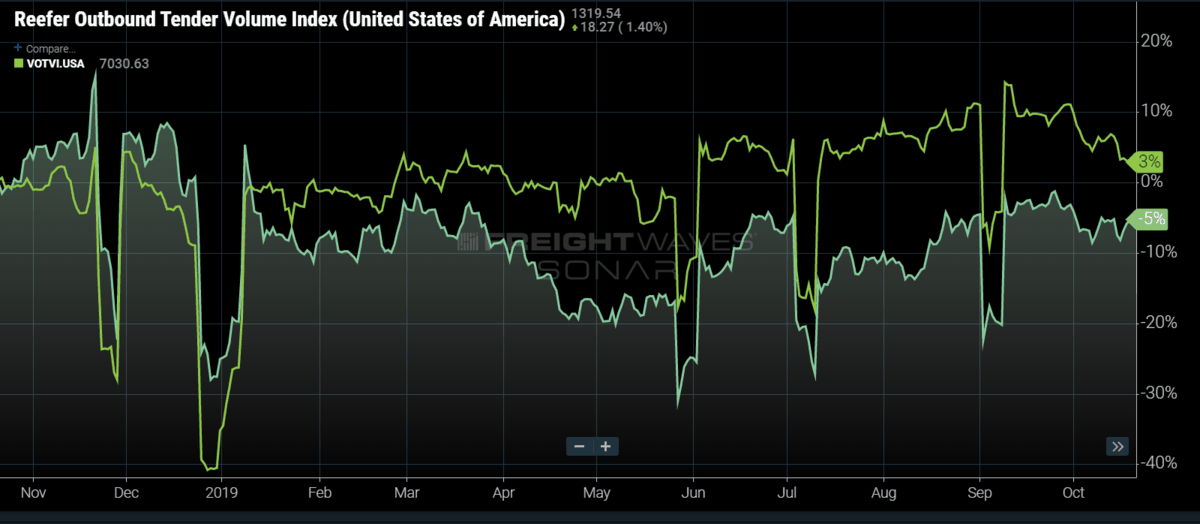
Chart: FreightWaves SONAR