


Name something that costs far more than it did before the pandemic that simultaneously gives you far less value for your money than it used to.
Of all the goods and services in the world, it’s hard to find a better pick than ocean container shipping. As rates have skyrocketed, delivery reliability has collapsed amid historic port congestion. Ocean cargo shippers are paying more than they ever have before for the worst service they’ve ever experienced.
The true COVID-era inflation rate for ocean shipping, when adjusted upward to account for lower quality, is much higher than the rise in freight rates.
Rates spike, quality plummets
For businesses that rely on imports and exports, ocean shipping is a necessity, not a luxury, so pricing rises if demand exceeds supply regardless of how bad the service is.
U.K.-based consultancy Drewry recently upped its forecast and now predicts that global container rates will increase by an average 126% this year versus 2020, including both spot and contract rates across all trade lanes.
Norway-based data provider Xeneta sees most long-term contract rates in the Asia-West Coast route averaging $4,000-$5,000 per forty-foot equivalent unit, double rates of $2,000-$2,500 per FEU at this time last year.
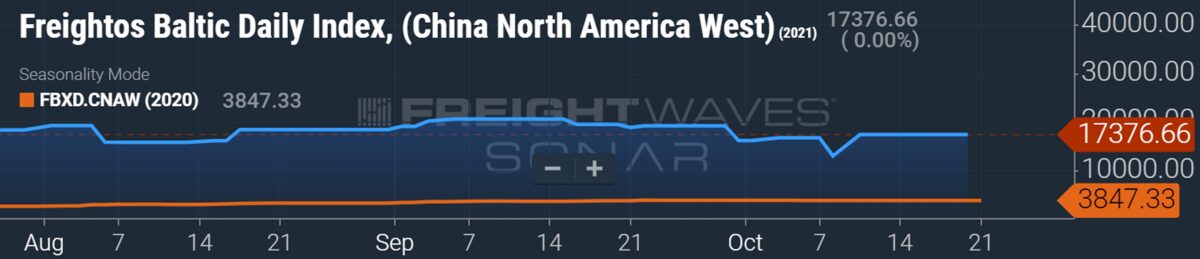
Spot rates have risen much more than that, both in dollar and percentage terms. The Freightos Baltic Daily Index currently assesses the Asia-West Coast spot rate (including premium charges) at $17,377 per FEU, 4.5 times the spot rate a year ago.
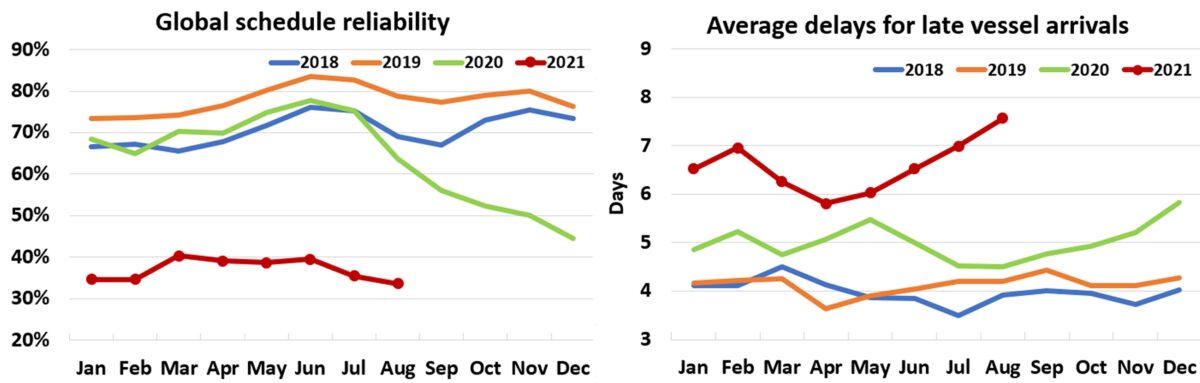
Service metrics have sunk as rates have risen. Denmark-based consultancy Sea-Intelligence reported that global carrier schedule reliability fell to 33.6% in August, an all-time low. In August 2019, pre-COVID, reliability was more than double that. Sea-Intelligence calculated that the global delays for late vessels was 7.57 days, almost double the number of days late in August 2019.
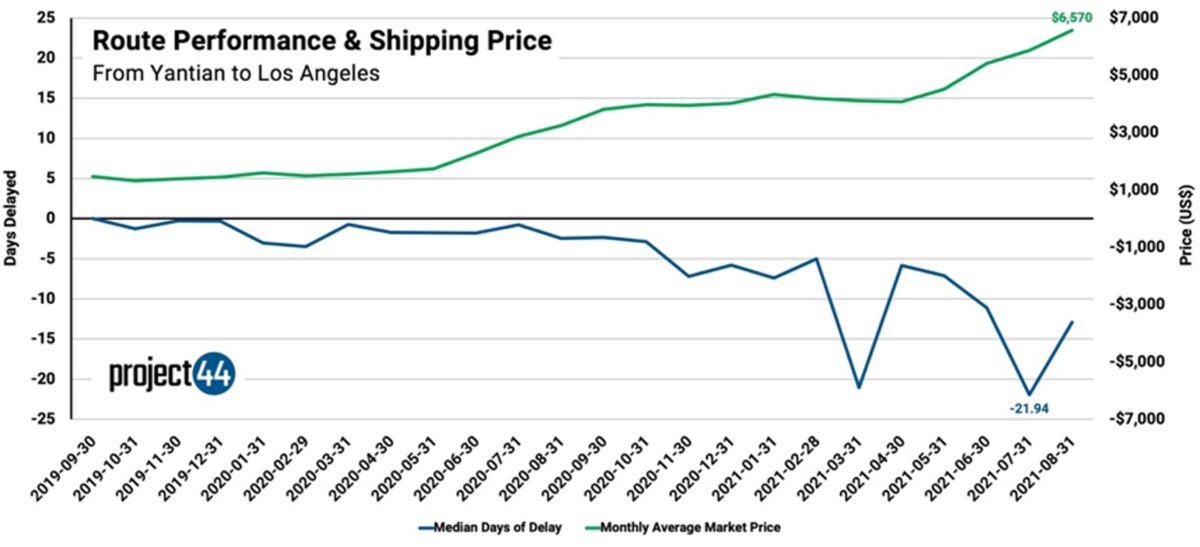
U.S.-based supply chain visibility platform Project44 highlighted the diverging paths of pricing and quality by contrasting its data on average days delayed with Xeneta’s short-term rate data. Between August 2020 and this August, project44 found that the monthly median of days delayed on voyages from Yantian, China, to Los Angeles increased 425%, from 2.46 days to 12.93. Over the same period, average short-term rates jumped 102%.
Shadow inflation
Neil Irwin of The New York Times recently wrote about “shadow inflation” — when you pay the same as before for something that’s not as good as it used to be, so you’re effectively paying more.
A pre-COVID example of shadow inflation: the infamous Lay’s potato chip incident of 2014. Lay’s intentionally included about five chips less per bag, lowering content from 10 ounces to 9.5, yet still charged $4.29 per bag, meaning customers were paying (and Frito-Lay was making) 5.3% more per ounce of chips.
The opposite — and until COVID, far more common — scenario is when product quality rises faster than pricing, decreasing effective inflation, as in the case of computers and other tech products. This downward effect on inflation is incorporated into the Consumer Price Index (CPI) via so-called hedonic adjustments.
As recounted by Irwin and Full Stack Economics author Alan Cole, COVID flipped hedonic adjustments in the other direction, toward lower quality per dollar paid, the equivalent of inflation.
Pointing to restaurants and hotels, Irwin wrote, “Many types of businesses facing supply disruptions and labor shortages have dealt with those problems not by raising prices (or not only by raising prices), but by taking steps that could give their customers a lesser experience.”
According to Cole, “Over the last 18 months … goods and services are getting worse faster than the official statistics acknowledge,” implying that “our inflation problem has actually been bigger than the official statistics suggest.”
Shadow inflation and container shipping
Ocean container shipping is an extreme example of the “services are getting worse” trend, despite enormous freight-rate inflation.
Measuring quality adjustments to inflation is inherently difficult, which is why very few CPI categories have hedonic adjustments. One way to do a back-of-the-envelope estimate of ocean shipping shadow inflation is to focus on time: the longer the delays, the less quality, the higher the cost fallout, the higher the effective inflation above and beyond the rise in freight rates.
Jason Miller, associate professor of supply chain management at Michigan State University’s Eli Broad College of Business, suggested using accounting of inventory carrying costs to measure the time effect.
“If I already own a product and I took possession of it overseas at the port of departure, and it’s on my balance sheet and it’s just sitting on the water, then in inventory management, there is a charge incurred every day it’s not sold,” he explained.
Miller explained, “There is the cost of capital. Every $100 in inventory is $100 that can’t be allocated elsewhere for a more value-producing purpose. There is also the cost due to obsolescence. It’s essentially opportunity costs. The longer the delay, the more additional costs from stockouts [as shelves empty] or the need to buy more safety stock.”
Rate rises affect different shippers differently
Whether it’s price inflation from rate hikes or indirect shadow inflation from slow service, different shippers are affected very differently.
On the rate side of the equation, Xeneta data shows a massive $20,000-per-FEU spread between the lowest price paid by large contract shippers in the trans-Pacific trade and highest price paid by small spot shippers.
Erik Devetak, chief data officer of Xeneta, told American Shipper, “We see the very bottom of the bottom of the long-term market at approximately $3,300 per FEU, although there are very few contracts at this price. On the other hand, we see the short-term market high up to $23,000 per FEU, again, in rare situations.”
In the latest edition of its Sunday Spotlight report, Sea-Intelligence analyzed how rate hikes affect different shippers and found a huge competitive advantage for larger shippers given this gaping freight spread.
Sea-Intelligence, using Xeneta data, estimated that a large importer on contract (in this case, in the Asia-Europe trade) shipping a 40-foot box with $250,000 of high-value cargo would see freight costs rise from 0.5% of the cargo value a year ago to 1.8% currently — an easily digestible increase. A small shipper in the spot market moving the same load would see freight costs jump from 0.7% of cargo value to 6.2%.
Sea-Intelligence then ran the same exercise with a low-value cargo worth $25,000. It said that in this case, the large contract shipper’s freight-to-cargo-value ratio rose from 5% last year to 18% currently, while the small spot shipper’s freight-to-cargo-value “exploded” from 7% to 62%.
Service delays affect different shippers differently
Rising rates affect high-value cargo the least because the freight rise equates to a small proportion of the cargo value. But with shadow inflation from voyage delays, it’s the opposite, according to Miller. Shipments of high-value goods get hit much harder than low-value goods.
Accounting carrying costs are derived from cargo value. The higher the cargo value, the higher the carrying costs. “Where these delays especially matter is for high-value imports,” said Miller. “It’s ironic. The importers that are least affected by high spot prices are the ones who are getting really hurt most by the delays.”
One example: A large importer pays $4,000 in freight under a contract to ship a high-value cargo of $250,000 worth of electronics in a 40-foot box. There is a 30% annual carrying cost, in part due to high obsolescence risk, thus a carrying cost of $205 per day, so a 10-day delay would equate to an accounting cost of $2,050, adding 51% on top of the freight cost.
A contrasting example: A small importer pays $15,000 in the spot market to ship a low-value cargo of $25,000 worth of retail products in a 40-footer, with a 20% annual carrying cost. A 10-day delay would equate to an accounting carrying cost of $137, just 1% more on top of the freight rate.
It’s not just high-value cargoes that suffer from delays, Miller continued. Obsolescence risk is key. On the high end of the value spectrum, that relates to goods like electronics; on the low end, to things like holiday items and seasonal fashion.
Another major factor: whether the delayed import item is a component in a manufacturing process. In that case, the cost of ocean shipping delays can be enormous, dwarfing the increase in freight rates.
American Shipper was recently contacted by a manufacturer that has a vital component of its production process trapped in containers aboard a Chinese container ship that has been at anchor waiting for a berth in Los Angeles/Long Beach since Sept. 13.
“When imports are actually inputs into a production process, and if a stockout is going to shut down a plant, you are now facing a huge opportunity cost,” warned Miller.
Click for more articles by Greg Miller
Related articles:
- $22B worth of cargo is now stuck on container ships off California
- How supply chain chaos and sky-high costs could last until 2023
- Shipping chaos gives top importers ‘massive competitive edge’
- Just how many containers of cargo are stuck off California’s coast?
- Global demand isn’t booming. So why are shipping rates this high?