


The highlights from Thursday’s SONAR reports. For more information on SONAR — the fastest freight-forecasting platform in the industry — or to request a demo, click here. Also, be sure to check out the latest SONAR update, TRAC — the freshest spot rate data in the industry.
Lanes to watch
By Zach Strickland, director, Freight Market Intelligence
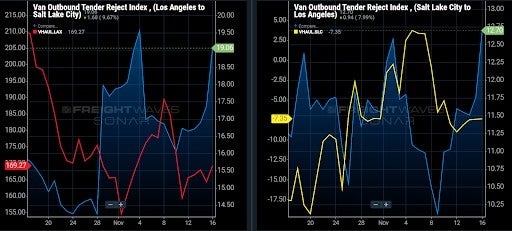
LOS ANGELES to SALT LAKE CITY
Overview: Dry van rejection rates climb to 19.06% on the LAX–SLC lane, and 12.70% on the SLC–LAX lane.
Highlights:
- Dry van rejection rates have increased to 19.06% on the LAX–SLC lane as the Los Angeles Headhaul score climbs to 169.27.
- Salt Lake City’s Headhaul score remains low at -7.35, but dry van rejection rates have increased to 12.70% on the SLC – LAX lane as spot rates improve.
- Salt Lake City shippers have increased dry van tender lead times to 2.56 days as market conditions tighten.
What does this mean for you?
Brokers: Market conditions have tightened in Los Angeles, pushing dry van rejection rates up to 18.56%. Brokers should search the spot market for dry van loads that run across the LAX – SLC lane where rejection rates have increased to 19.06%, helping shippers secure capacity for their loads. SONAR’s Market Dashboard suggests brokers bid this lane at around $3,800 or higher, and secure capacity at $3,225 or less for at least a 15% margin on the lane.
Carriers: Dry van carriers with excess capacity in the Los Angeles market should search the spot market for loads that deliver into Salt Lake City. Spot rates are averaging $4.69 all-in, with a range between $4.30 and $4.84 according to SONAR’s Market Dashboard. Return spot rates are averaging between $1.31 to $1.43 all-in rpm, but carriers need to book these loads early since Salt Lake City’s Headhaul score is in the negative. Carriers should be able to average at least $2.80 all-in rpm on the round-trip run.
Shippers: Shippers in Salt Lake City need to increase dry van tender lead times out near 3 days as market conditions tighten. Between the tightening in capacity, and possible winter weather events, shippers will feel a lot of pressure when trying to secure capacity. Work with your contracted carriers, and push them to accept your loads, even if you have to work out a short-term contract through the end of the year.
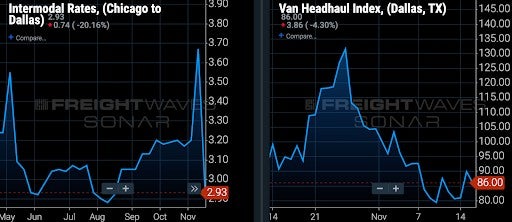
CHICAGO to DALLAS
Overview: Intermodal spot rates have been cut to 10% below the dry van spot rate shown in SONAR Market Dashboard.
Highlights:
- Of the major domestic intermodal lanes, door-to-door intermodal spot rates moved the most in the past week in the Chicago to Dallas lane. The rates declined 20.1% week-over-week (w/w) to $2.93/mile, including fuel surcharges.
- Following the cut in the intermodal spot rate in the lane in the past week, the intermodal spot rate is now 10% below the current dry van spot rate of $3.24/mile, including fuel surcharges (according to the new SONAR Market Dashboard tool).
- In the past week, the dry van outbound tender rejection rate in the lane increased 115 basis points (bps) to 20.35%. That tender rejection rate is 122 bps higher than the nationwide van tender rejection rate.
What does this mean for you?
Brokers: The rising tender rejection rate in the lane suggests that brokers should prioritize covering loads in the lane. When negotiating with carriers, cite the Dallas Van Headhaul Index, which shows that Dallas is currently a Headhaul market.
Carriers: Dallas is currently a solid destination for dry van carriers. The Dallas van outbound tender rejection rate of 18.8% is roughly in line with the national van rejection rate and the Dallas Van Headhaul Index of 86 means that it is a Headhaul market (so it should be easy for carriers to get reloaded).
Shippers: Spot shippers of dry van freight will have to weigh whether intermodal, with door-to-door intermodal rates 10% below dry van rates, are worth the longer transit times and potential delays caused by lingering intermodal service issues. Highway shippers should keep in mind that inbound Dallas capacity has become more difficult to source in the past week with the Dallas van inbound tender rejection rate increasing 176 bps w/w.
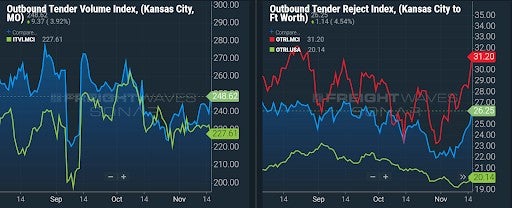
KANSAS CITY (Missouri) to FORT WORTH (Texas)
Overview: Capacity is likely to tighten further as the Headhaul Index increases 20% w/w.
Highlights:
- Kansas City’s outbound tender volumes are up 6% w/w, signaling an increase in demand for truckload capacity.
- The Kansas City Headhaul Index is up 20% w/w, signaling a growing imbalance between inbound and outbound truckload volumes.
- Kansas City outbound tender rejections are up 4.6% w/w, signaling that capacity is likely already tightening.
What does this mean for you?
Brokers: While capacity may not be as tight on the Kansas City to Fort Worth lane as it is for the entire Kansas City market, the major 20% increase in the Headhaul Index w/w is likely to cause a tightening of capacity across all outbound lanes in the coming days. With tender rejections in Kansas City over 11% higher than the national average, be sure to prioritize outbound Kansas City loads to ensure coverage.
Carriers: Stay firm on your rates for your outbound Kansas City loads, as there is significant upward pressure coming from the 6% w/w increase in outbound volumes, coupled with the 20% increase w/w in the Headhaul Index. With outbound tender rejections over 11% higher than the national average, you have pricing power in your favor.
Shippers: Your shipper cohorts currently have tender lead times at 3.5 days, but these will likely need to be pushed to 4 days to ensure proper coverage in the tightening Kansas City market. With outbound tender rejections already over 11% higher than the national average, you need to prioritize increased tender lead times on these loads to mitigate rising costs for capacity.
Watch: Shipper Update
TRAC: Salt Lake City rejections and rates
By Jim Knuerr, SONAR account executive
With our new pricing tool TRAC being released, I wanted to look into the correlations between Rejections and Rates.
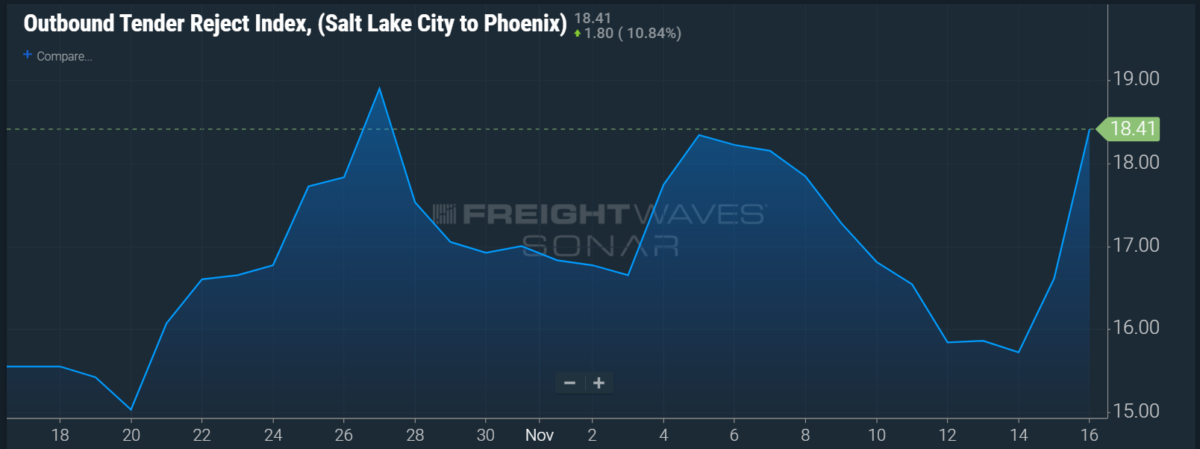
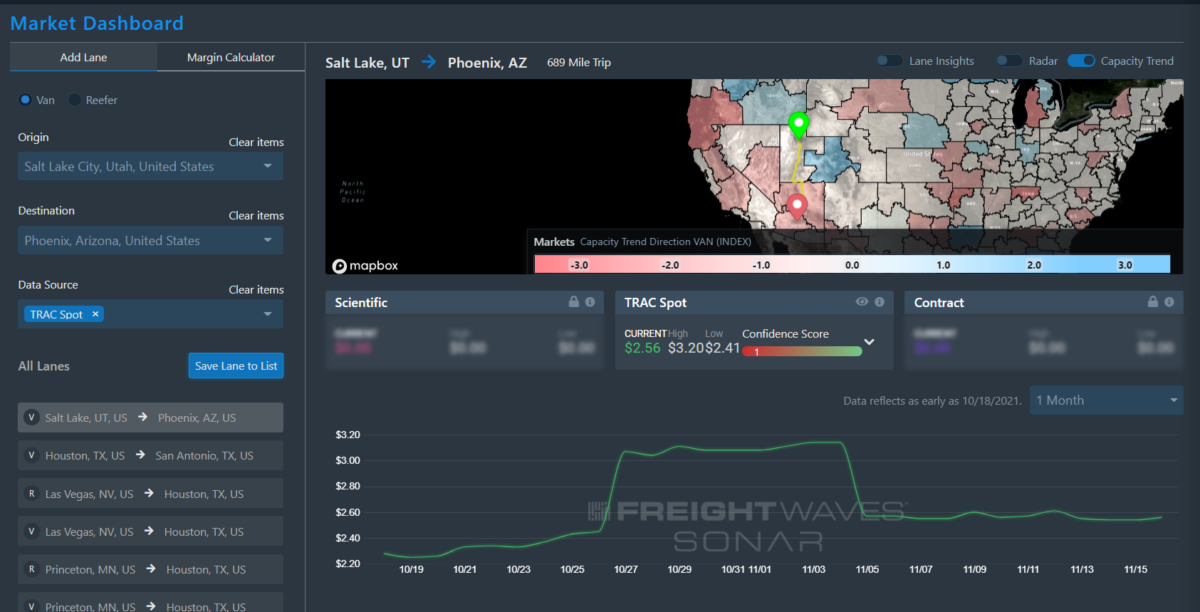
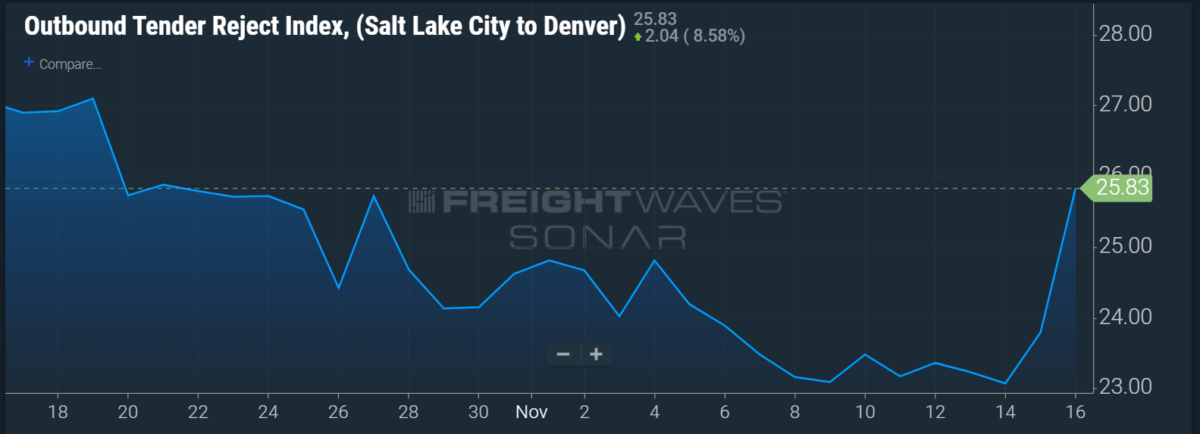
This week, I looked into the Salt Lake City Market and dived two lanes, Salt Lake City to Phoenix and Salt Lake City to Denver. The last month, rejections from Salt Lake City to Phoenix have increased by 19%, and the rates on this lane also increased from $2.28 per mile to $2.56 per mile.
Outbound Tender Rejection, SLC to PHX
Market Dashboard Rate, SLC to PHX
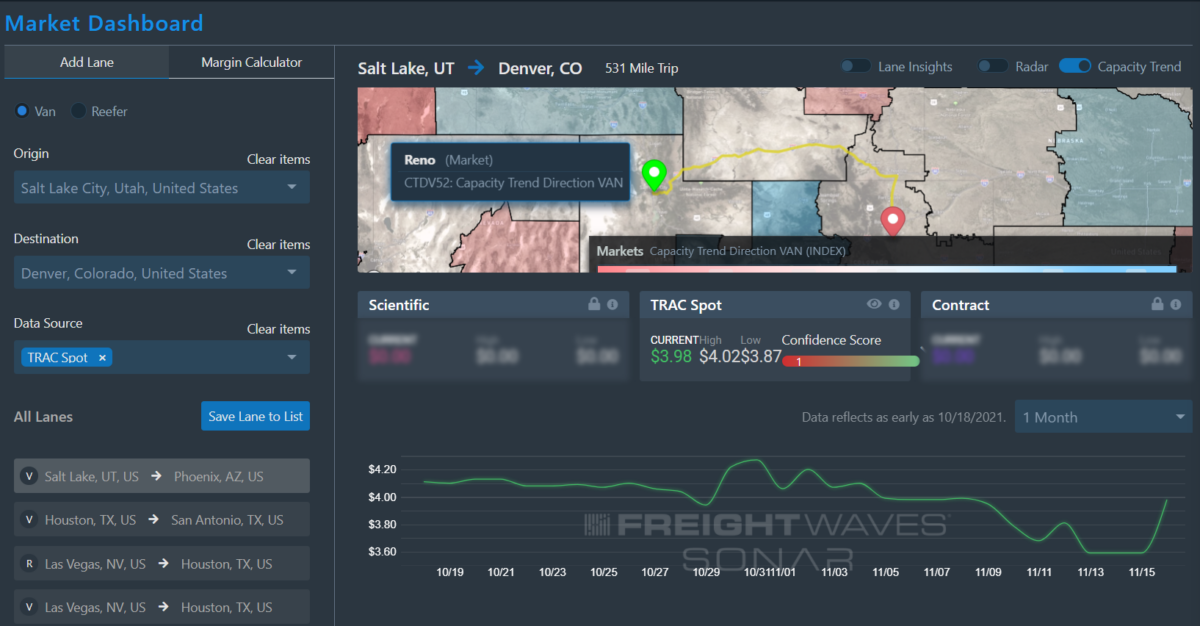
Now I also wanted to look at the same origin, but with a destination market that dropped in rejections, Salt Lake City to Denver Rejections dropped 4.7%, the rate on this lane also dropped from $4.11 to $3.98.
Outbound Tender Rejection, SLC to DEN
Market Dashboard Rate, SLC to DEN
Knowing rates is important for all aspects of shipping, but understanding the why will make you a better resource for all parties. FreightWaves offers both sets of data and will help you be a better repressive in any role and have a greater understanding of the freight marketplace as a whole.
Watch: Carrier Update
Focus on … Long-haul Outbound Tender indices
By Zach Strickland
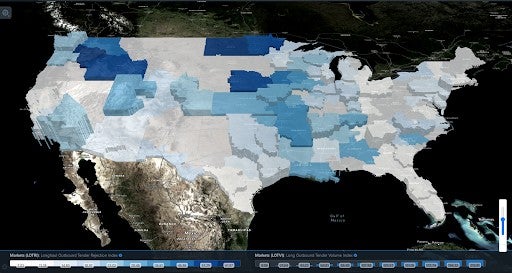
The national average for long-haul outbound tender rejection rates has increased to 21.72% over the past couple of weeks as capacity tightens before the Thanksgiving holiday.
Long-haul freight volumes have been trending downward but rebounded to 3070.83 index points yesterday.
Shippers in the Pendleton, Twin Falls, Fargo and Omaha markets are struggling with long-haul rejection rates over 50%, and long-haul rejection rates are over 35% in the Spokane, Des Moines, Cedar Rapids, Little Rock, Dubuque, Joplin and Fayetteville markets as spot rates increase, enticing carriers to reject their contracted freight for higher paying loads on the spot market.
Carriers will find the most opportunities for long-haul freight in the Ontario, Los Angeles, Dallas, Elizabeth, Atlanta, Houston, Joliet, Chicago, Fort Worth, Denver, Memphis and Salt Lake City markets, which are currently the largest long-haul freight markets by volume in the nation.
