The highlight reel from Wednesday’s SONAR reports. For more information on SONAR — the fastest freight-forecasting platform in the industry — or to request a demo, click here.
Lanes to watch
By Zach Strickland, director, Freight Market Intelligence
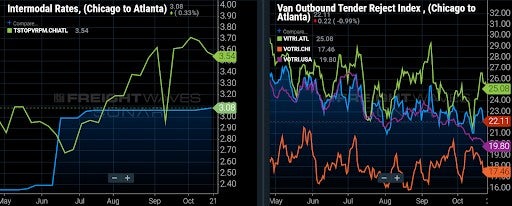
CHICAGO to ATLANTA
Overview: Brokers should prioritize covering this lane with some carriers avoiding the Atlanta market.
Highlights:
- The van tender rejection rate in the lane is 22.1%, which is 230 basis points above the national van rejection rate. The variance is driven by the above-average Atlanta inbound van rejection rate of 25.1%.
- The Atlanta Van Headhaul Index of -16 suggests that the reason some carriers are reluctant to head to Atlanta is its current backhaul status.
- The door-to-door domestic intermodal spot rate of $3.08/mile, including fuel surcharges, is 13% below the dry van truckload spot rate of $3.54/mile, also including fuel surcharges.
What does this mean for you?
Brokers: Prioritize covering loads in this lane given that many carriers are avoiding Atlanta and raise your rates in the lane to preserve margins. SONAR data shows a rising inbound Atlanta tender rejection rate and dry van spot rates near the high end of their recent range which suggests that brokers may have to pay more for capacity.
Carriers: If accepting loads in the lane, be sure to get compensated for the fact that Atlanta is currently a backhaul market with a van outbound tender rejection rate (16.6%) that is below the national van tender rejection rate (19.8%).
Shippers: The comparison between dry van spot rates and intermodal spot rates, which shows a 13% discount for intermodal, suggest that the market is acting rationally. However, intermodal service levels have often been poor in recent months, particularly in the eastern third of the U.S. Therefore, shippers should only use intermodal in the lane for shipments that do not have tight time requirements.
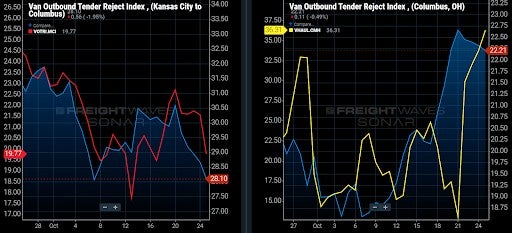
KANSAS CITY (Missouri) to COLUMBUS (Ohio)
Overview: Dry van rejection rates remain elevated on the MCI–CMH lane at 28.10% as the MCI market average falls to 19.77%.
Highlights:
- Dry van rejection rates have fallen to 19.77% in the Kansas City market, but the MCI–CMH lane has held well above the market average at 28.10%.
- Columbus’ dry van Headhaul score has jumped up to 36.31 as market conditions tighten, which could allow for carriers to increase their spot rates for on-demand capacity.
- Columbus shippers have increased their dry van tender lead times slightly to 2.60 days as pressure is applied from the shift in market conditions.
What does this mean for you?
Brokers: Market conditions are softening in the Kansas City market, which has allowed dry van rejection rates to fall to 19.77% as carriers fall back in compliance with their contracted freight. Brokers should search the spot market for loads that run across the MCI–CMH lane, which currently carries a 28.10% rejection rate, but keep your bids elevated even though rejection rates are trending downward on that lane. Push carrier rates down since market conditions are deteriorating in Kansas City, and tightening in Columbus.
Carriers: Dry van carriers with excess capacity in the Kansas City market should search the spot market for loads that deliver into the Columbus market. Rejection rates on the MCI–CMH lane are declining, but remain elevated at 28.10%, which is well above the market average of 19.77%. Market conditions in Columbus have tightened as outbound freight volumes increased, which could increase rejection rates as spot rates start to increase.
Shippers: Columbus shippers need to increase dry van tender lead times since market conditions have tightened in the Columbus market. Outbound tender volumes have increased, pushing the dry van Headhaul score up to 36.31. If these conditions continue, spot rates for on-demand capacity will start to climb, and rejection rates will increase.
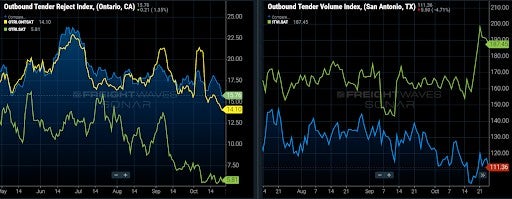
ONTARIO (California) to SAN ANTONIO
Overview: Inbound demand surges to San Antonio.
Highlights:
- Ontario’s outbound rejection rate has fallen over two percentage points over the past ten days, pushing it to its lowest value since May.
- Strangely, rejection rates to the extremely oversupplied San Antonio market have also fallen significantly and are below the Ontario market average.
- San Antonio’s outbound rejection rates are among the lowest in the U.S., below 6%, thanks in large part to the large gap between inbound and outbound demand.
What does this mean for you?
Brokers: Expect easing conditions in this lane, but do not expect to lowball the rate and be successful. Carrier rejection rates are strangely low to this market, but it is probably due to contract rates being high enough to cover deadhead to Dallas or another stronger outbound market.
Carriers: Make sure your rates cover significant deadhead out of San Antonio as the market is one of the most oversupplied for its size in the U.S. Rejection rates from Ontario suggest contract rates have risen dramatically over the past few months, leading to much less spot market activity out of San Antonio.
Shippers: Consider increasing your rates if compliance has dropped below the market level of 85% in this lane. Rate increases in lanes like this are some of the more significant in the U.S. thanks to the large consistent imbalance of freight flows that have been exacerbated during the pandemic era.
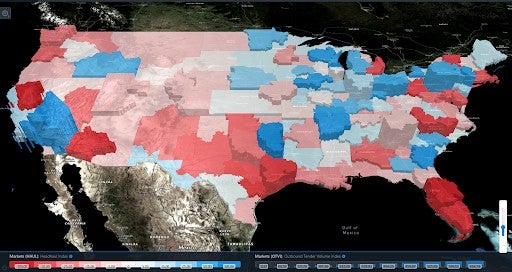
Headhaul Index: Run to the blue
By Zach Strickland
The Headhaul Index (HAUL) calculates the difference between the Outbound Tender Volume Index (OTVI) and the Inbound Tender Volume Index (ITVI). By measuring the flow of outbound and inbound freight in a market, SONAR users are able to measure capacity over time, based on the inbound and outbound trucks that are moving freight.
The Headhaul Index helps carriers better position their trucks. Run to the blue. Blue markets contain more freight than trucks, giving carriers more freight options to choose from, and can lead to better rates if the Headhaul score remains elevated over a period of time, meaning tightened capacity. Red markets warn carriers of regions that are saturated with capacity, pressing outbound rates down in those markets.
In the map below, the Headhaul Index has been compared to outbound tender volumes so SONAR users can see which blue markets have the highest freight volumes.
Shipping rates and consumer price inflation
An excerpt from Greg Miller’s story:
Shipping costs could temporarily boost inflation, according to the Organization for Economic Co-operation and Development (OECD).
It said, “The empirical approach to answer this question: first, quantifying the pass-through of shipping costs to merchandise import price inflation, and second, assessing the transmission of import price inflation to consumer price inflation.”
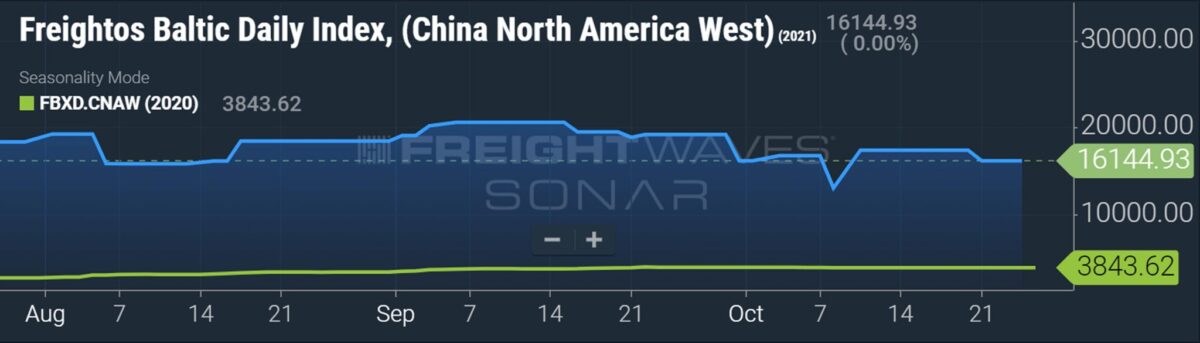
The evidence for import price inflation: Both ocean shipping contract and spot rates are up sharply. Data provider Xeneta estimates that Asia-West Coast contract rates have doubled year on year, to $4,000-$4,500 per forty-foot equivalent unit. According to the Freightos Baltic Daily Index, spot rates in that lane are at around $16,100 per FEU, more than quadruple spot rates at this time last year.