


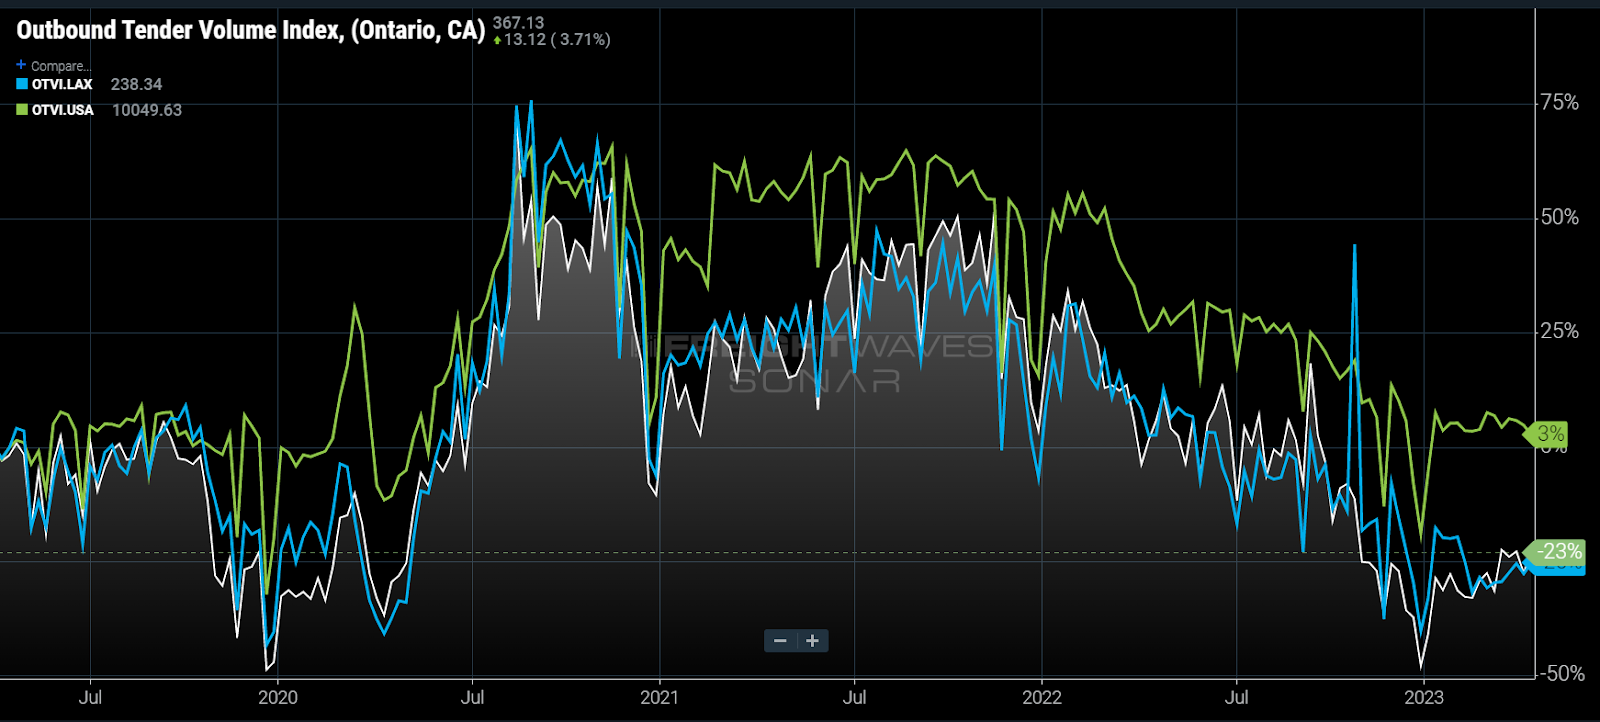
Chart of the Week: Outbound Tender Volume Index – Los Angeles, Ontario, USA SONAR: OTVI.LAX, OTVI.ONT, OTVI.USA
Southern California truckload tender volumes are ~23% lower than April 2019, prior to the pandemic, while in total, national tender volumes are still showing growth versus four years ago.
California was the epicenter of freight demand in 2020-2021 as companies pulled freight in from overseas to the ports of Los Angeles and Long Beach, the busiest by total volume handled in the U.S. The demand overwhelmed rail and truckload networks and pushed rates to record levels.
While few expected the overheated demand to last, there were probably fewer that expected demand to erode below pre-pandemic levels to this extent. The resulting imbalance has not only made it challenging for carriers to manage their networks, but their pricing is also now nonsensical in relation to their needs.
Every carrier has a unique customer footprint to manage with an amount of trucks needed in markets to make pickups every day. Shipping demand is naturally unbalanced in the U.S. with very few markets needing the same amount of deliveries and pickups in a day. The Southern California markets have been strongly imbalanced to the outbound side, meaning there is more freight available for pickup than delivered.
While that is still true in general, the market is not as outbound heavy as it once was.
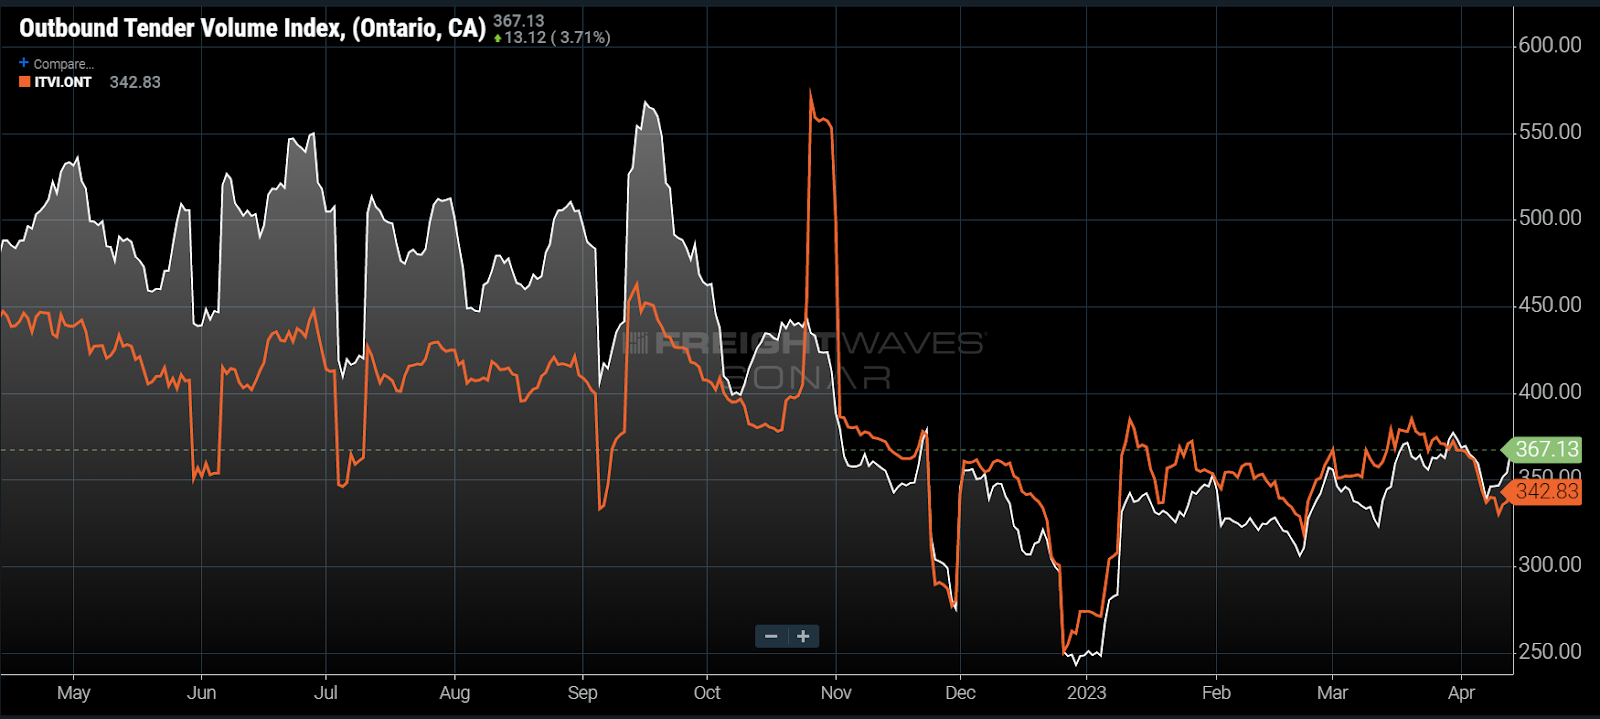
The Ontario, California, market represents the eastern half of Los Angeles, known as the Inland Empire, and is currently the second-largest outbound market in the U.S. As recently as September of last year, outbond tender volumes exceeded inbound load requests by about 20%. Over the winter, inbound volumes exceeded outbound demand.
Carriers normally price their loads to move into Los Angeles at lower margins and even losses because they know there are typically more loads available than capacity.
Looking at the Los Angeles-to-Chicago lane and return trip rates illustrates this headhaul/backhaul relationship. Headhaul (more demand than supply) lanes are generally more expensive than backhaul lanes (more supply than demand).
The spot rate according to FreightWaves Trusted Rate Assessment Consortium (TRAC) for loads moving from Los Angeles to Chicago in early November 2021 was $2.98, with the return trip being $1.63.
The rates in the same lanes as of Friday were $1.50 for LA to Chicago and $1.71 for the return, a dramatic flip.
The contract market is much slower to move than the spot market, since those rates are negotiated with longer intervals. During the pandemic, carriers put in aggressively low rates for inbound Los Angeles freight in order to get enough capacity into position, knowing they would more than make up for the cheap rate on the way back out.
Those rates have not had enough time to move back into balance, but they are also challenged by shippers expecting lower rates in general.
So not only does the market currently have low demand with network imbalance issues but also a severe pricing imbalance problem. Transportation managers should be monitoring their rates and service both in and out of Southern California over the next year because of this. Not all rates have downward pressure on them, even in a soft capacity market. Cheap inbound Los Angeles lanes will be the most exposed if/when the market turns.
About the Chart of the Week
The FreightWaves Chart of the Week is a chart selection from SONAR that provides an interesting data point to describe the state of the freight markets. A chart is chosen from thousands of potential charts on SONAR to help participants visualize the freight market in real time. Each week a Market Expert will post a chart, along with commentary, live on the front page. After that, the Chart of the Week will be archived on FreightWaves.com for future reference.
SONAR aggregates data from hundreds of sources, presenting the data in charts and maps and providing commentary on what freight market experts want to know about the industry in real time.
The FreightWaves data science and product teams are releasing new datasets each week and enhancing the client experience.
To request a SONAR demo, click here.

William
I see lots of freight trains pulling containers through Cajon Pass, two per car, stacked. These are stack trains, pulled by BNSF and/or Union Pacific. At least four or five tracks run parallel. I see those stack trains on YouTube. Most stack trains, with trailers, hauling freight, are really long.
That’s money on the rails
Stephen Webster
Same is happening to loads going to ont canada are under $2 U S a mile from much of U S outbound is still $3 U S with the east coast at $3.5us plus tolls i lot of used reefer and dry van early lease returns trailers are now much cheaper than 8 months ago
Drivers wage in ont canada are down 20%
Bar
Homeless people don’t drive
Dr Rock
Units?
$2.98?
$1.63 ? Per what…..