


[vimeo-autoplay video-id=”459404703″]
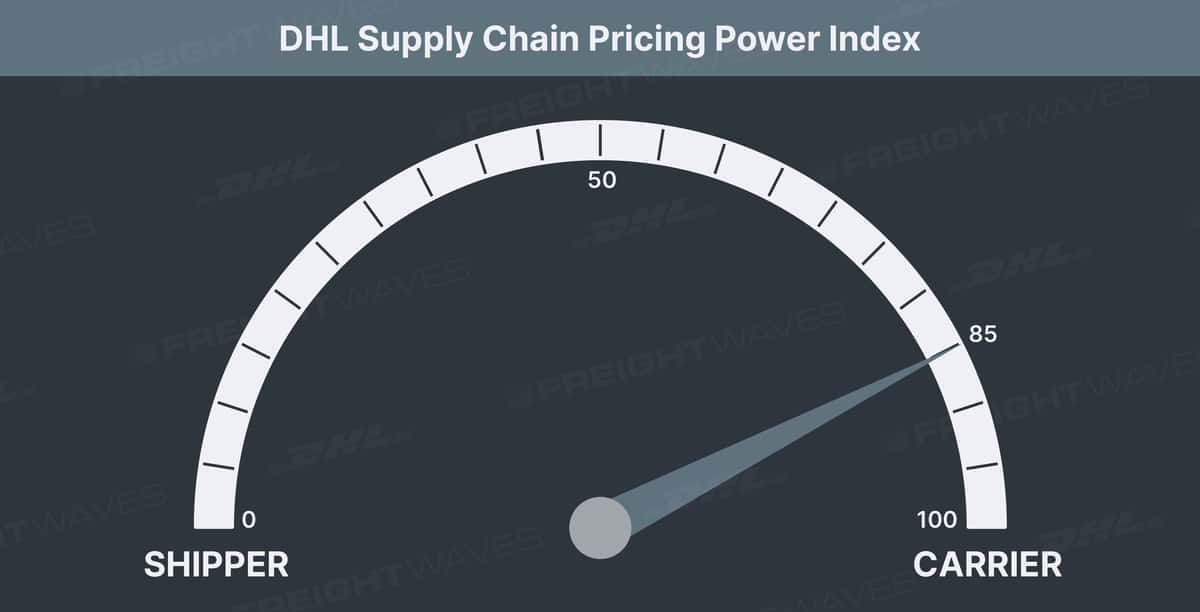
This week’s DHL Supply Chain Pricing Power Index: 85 (Carriers)
Last week’s DHL Supply Chain Pricing Power Index: 85 (Carriers)
Three-month DHL Supply Chain Pricing Power Index Outlook: 80 (Carriers)
The DHL Supply Chain Pricing Power Index uses the analytics and data in FreightWaves SONAR to analyze the market and estimate the negotiating power for rates between shippers and carriers.
Lingering distortions from the Labor Day holiday make weekly comparisons difficult. Accepted tenders up 15% year-over-year this week, compared to 18% a week ago. Carriers are being particularly selective and rejecting more than 1 in 4 contracted loads, which has pushed spot rates above $3/mi. In 46/100 lanes.
The Pricing Power Index is based on the following indicators:
Load volumes: Absolute levels and momentum positive for carriers
Our Outbound Tender Volume Index (OTVI) is calculated on a seven-day moving average basis to smooth out interday fluctuations. Due to this, the index is distorted for the week following a national holiday, like Labor Day. This renders weekly comparisons near meaningless. However, we can analyze the yearly comps on an absolute level and on a velocity of decline basis.
In a continuation from last week, the accepted tender volume level will be calculated to account for the high level of rejected tenders distorting the total volume levels. To account for that, we can use this simple formula to calculate the level of accepted tenders: OTVI * (1-OTRI) for any given day.
13,676 * (1 – .26) = 10,120 accepted tender volume index value for Sept. 9, 2020
9,214 * (1 – .047) = 8,781 accepted tender volume index value for Sept. 9, 2019
Using this metric to control for the high level of rejected tenders allows us to get a more accurate understanding of the true demand level. This does not mean demand is not at a historically high level — it is. With this metric, trucking volumes (van, reefer, flatbed) are running up over 15% year-over-year.
We expect volumes to bounce back quickly next week when the index normalizes. In fact, we feel the rest of the year could be very strong for the industry as a whole. Retail inventories are down 12% year-over-year, while sales are up 11%. The possibility of another round of stimulus before the election would aid this argument. While consumer confidence has faltered, spending is remaining strong given the economic backdrop. These factors lead us to believe that freight volumes could end with a massive bang.

SONAR: OTVI.USA (2020 – Blue; 2019 – Green; 2018 – Orange)
Tender rejections: Absolute levels and momentum positive for carriers
Demand is simply outstripping capacity right now and nothing points to that changing anytime soon. Accepted tenders remain at a historically high level, and carriers are exercising their options in searching for the highest rates and best loads. In doing so, carriers are being selective — accepting less than three of every four tenders. Drivers are particularly selective in the days leading up to a holiday, as they search for loads that lead them home. OTRI climbed nearly 5% this week and has now matched the all-time high from March 2018 at 26.68%.
The demand throughput has carriers sitting comfortably rebidding or rejecting loads full stop. OTRI at 26% indicates one in four contracted loads is being rejected across the country. This is historically an extremely high rate and is close to what we believe is the upper bound of the index. We believe the market dynamic shifts at this level and we begin seeing contracted freight renegotiated at higher rates, thus leading to lower rejection rates. The managing director of a large, national freight brokerage confirmed to us that the market has already reached this level and renegotiations have begun. He believes this rebidding season will be the toughest for shippers (and brokers) in some time.
We believe there may be some normalizing after the Labor Day holiday, but we see no signs pointing to a major freight slowdown anytime soon. Consumer demand remains elevated on a yearly basis, and services spending has shifted to marginal good demand. This has benefited both shippers and carriers to this point, but capacity constraints are causing transportation costs to surge.

SONAR: OTRI.USA (2020 – Blue; 2019 – Green; 2018 – Orange)
Spot rates: Absolute levels and momentum positive for carriers
Spot rates spiked nearly 10% this week on a national level to $2.89/mile, according to Truckstop.com. This marks another consecutive week of new index series highs. Of the 100 lane pairings in SONAR, spot rates are above $3/mile in nearly half. Spot rates increased in all but 13 lanes this week.

SONAR: TSTOPVR
Rates have been gradually rising off the bottom in early May and are now above the 2018 summer peak. The rate of change accelerated this week, which is not uncommon for holiday weeks. Rates are up 30 cents a mile since last week, which brings the Truckstop.com national all-in rate to $2.89 a mile. Compared to this time last year, rates are up nearly 28% and trending higher.

SONAR: TSTOPVR.USA (2020 – Blue; 2019 – Orange)
Economic stats: Momentum and absolute level neutral
Several economic releases this week are worth noting.
Weekly jobless claims were released Thursday and give us one of the best close-to-real-time indicators of the overall economy.
This week’s jobs news reflects the improved momentum and change in tone we have seen in recent weeks and months. Initial jobless claims came in at 884,000 last week, which was worse than consensus expectations of 850,000 but continues the multi-week downward trend. This comes on the heels of three weeks ago being the first week that initial jobless claims fell below 1 million since mid-March. Jobless claims have now fallen in 20 of the past 24 weeks dating back to the peak weekly jobless claims number from late March. Continuing claims (a rough proxy for unemployment) ticked up modestly for the first time in several weeks by 93,000 to 13.4 million.
Initial jobless claims (weekly in 2020)

Source: CNBC, U.S. Department of Labor
Turning to consumer spending as measured by Bank of America weekly card (both debit and credit) spending data, total card spending in the latest week was up 7.4% year-over-year. This is well ahead of the recent flattish range and well off the ~40% declines from late March and early April. However, caution and discretion is warranted as there are almost certainly Labor Day distortions influencing this week’s numbers; we would be surprised if this pace of spending growth carries over into next week. As we usually note, keep in mind there is a beneficial mix shift from cash to debit ongoing that is somewhat inflating these numbers. One can tell this is the case from the fact that debit card spending is currently running up 15% year-over-year and far outpacing credit card spending, which is down 2% year-over-year.


The main takeaways this week are that spending softened slightly for the entire month of August for Bank of America’s card spending data falling by 0.4% month-over-month seasonally adjusted. This number was likely dragged down by the expiration of enhanced unemployment benefits at the end of July. According to Bank of America, the outlays for unemployment insurance (UI) from the Treasury Department fell to $2.56 billion per day in August (from $4.76 billion per day in July). This could be an even bigger headwind for retail sales in August from the U.S. Census Bureau because Bank of America’s card spending data does not capture cash spending or spending on prepaid UI cards.
By category, online electronics (up 94% year-over-year this week) and online retail (up 68%) continue to be the standout performers. Other strong categories include home improvement and furniture. Grocery has reaccelerated back to 13% year-over-year. Restaurant and bar spending has staged a huge comeback. Brick-and-mortar retail spending has improved dramatically as most states reopen and was actually flat year-over-year this week for the first time in months. Finally, airlines, lodging and entertainment continue to be the worst-performing categories by far, but lodging is way up off the bottom and appears to be gaining momentum in recent weeks. Airline and entertainment are now declining about 70% year-over-year compared to the trough of down 90-100% in early April.
Card spending by American consumers has a strong correlation with truckload volumes, so we will continue to monitor this data closely going forward.

Source: Bank of America Merrill Lynch
Transportation stock indices: Absolute levels and momentum positive for carriers
It was a decent week for our transportation indices following mostly strong weeks over the past couple of months. Logistics was the best performer at 1.4%, and parcels was the worst performer at -0.3% this week.


For more information on the FreightWaves Freight Intel Group, please contact Kevin Hill at [email protected], Seth Holm at [email protected] or Andrew Cox at [email protected].
Check out the newest episodes of our podcast “Great Quarter, Guys” here.

Stephen Webster
You are right about the truck supply getting much harder to get south bound trucks out of ont or east to new York or boston $3.00 U S plus tolls and not going to get any better as a lot of small Trucking companies because of high insurance costs and risk of coronavoius parked their trucks in Ontario in April and got jobs in construction or pulling gravel trailers. The shortage was caused by larger trucking companies getting wage subsidy then forcing smaller Trucking companies and owner ops in Ontario to close when unable to pay for the insurance and plates.
Clipping Path
Very effective topics discuss here! Thanks for sharing