


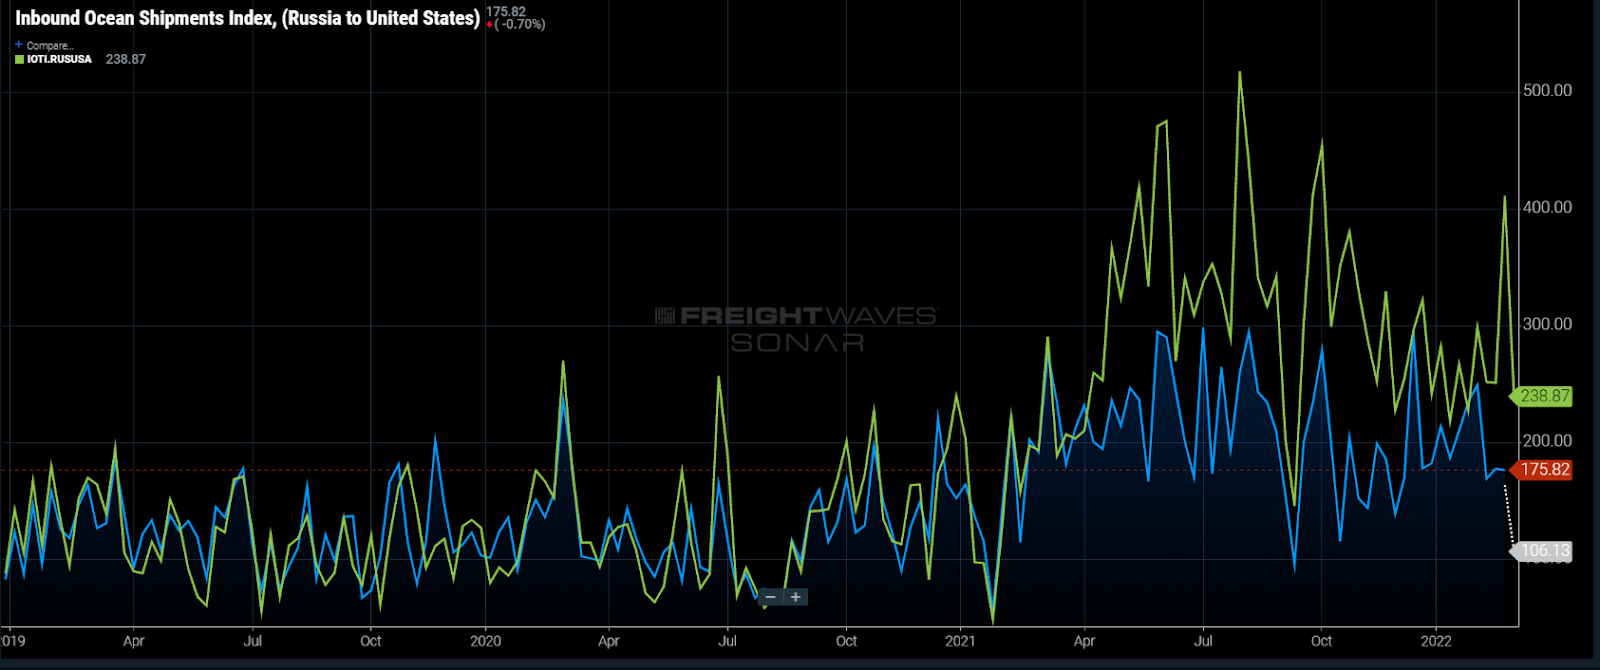
Chart of the Week: Inbound Ocean Shipments Index, Inbound Ocean TEUs Index – Russia to USA SONAR: IOSI.RUSUSA, IOTI.RUSUSA
Russian import bookings declined 40% over the past week and will obviously fall further after growing ~64% in 2021 from the previous year, resulting in a 75% increase in goods by value, according to the Census Bureau. This put the imported goods value at its highest level since 2012. This direct economic hit will more than likely be dwarfed by the numerous indirect consequences of Russia’s recent invasion yet to come.
Many companies have realized that geopolitical risk has become one of the biggest threats to supply chain management over the past four years. The U.S. trade war with China highlighted how much our two economies are reliant on each other for success thanks to many American companies relying on cheaper foreign production of their goods.
Countries with autocratic leadership may have a low-cost labor force but our ideals are not in alignment, which increases the risk for confrontation. Russia is not America’s largest trade partner by a long shot — representing less than 1% of the total imports — but many of our largest trading partners, like Germany and China, have strong economic ties to the country.
Most of the current supply chain woes have been driven by demand that exceeds the current transportation capacity limits. This conflict will impact maritime shipping capacity worldwide and add to the already present price inflation.
Russia is the world’s 11th-largest economy and one of the main producers of oil and supplier of industrial metals like aluminum and palladium, which have been increasing in price this year. All of these are critical components of production of finished goods that have been fueling the U.S. economic growth of the past year.
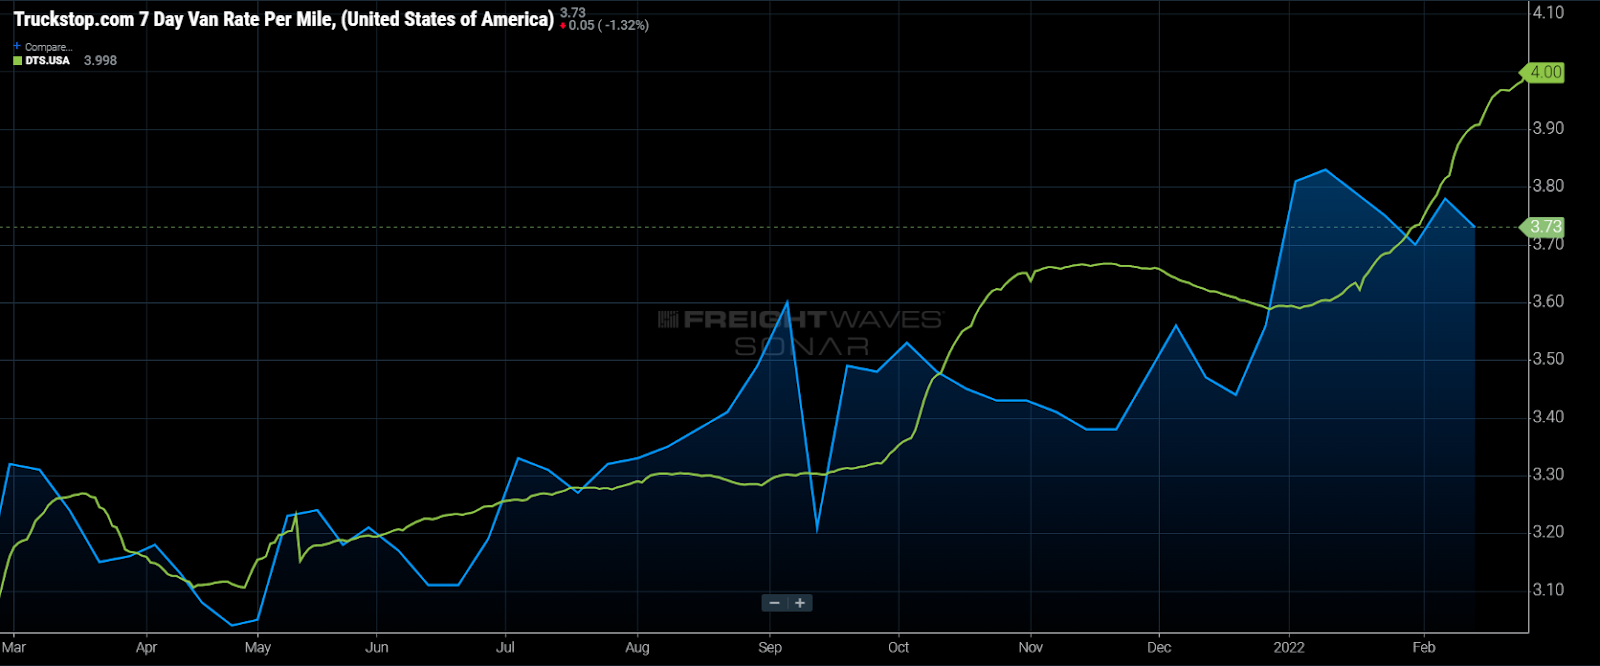
Oil prices have been erratic prior to the invasion but this will only make things worse. Fuel prices currently account for roughly 15%-20% of the current cost of spot truckload shipments and the sharp increase over the past few weeks will keep rates elevated even if the market eases.
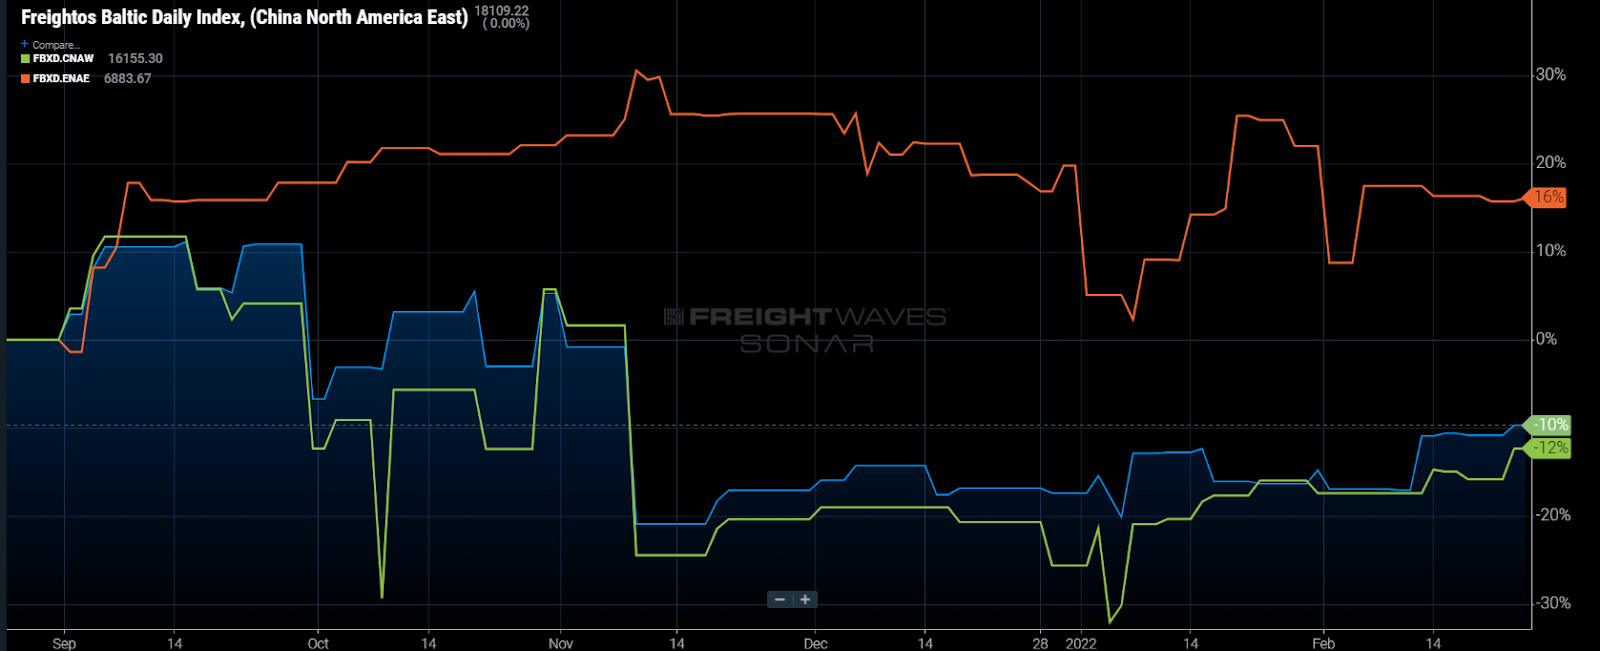
Spot rates for 40-foot equivalent container shipments have eased since peak season last August out of China, but are up 16% from Europe — where the most immediate impact on shipping capacity will be felt. And of course this event has the potential to inspire yet another round of panic purchases as questions emerge around production and transportation disruptions.
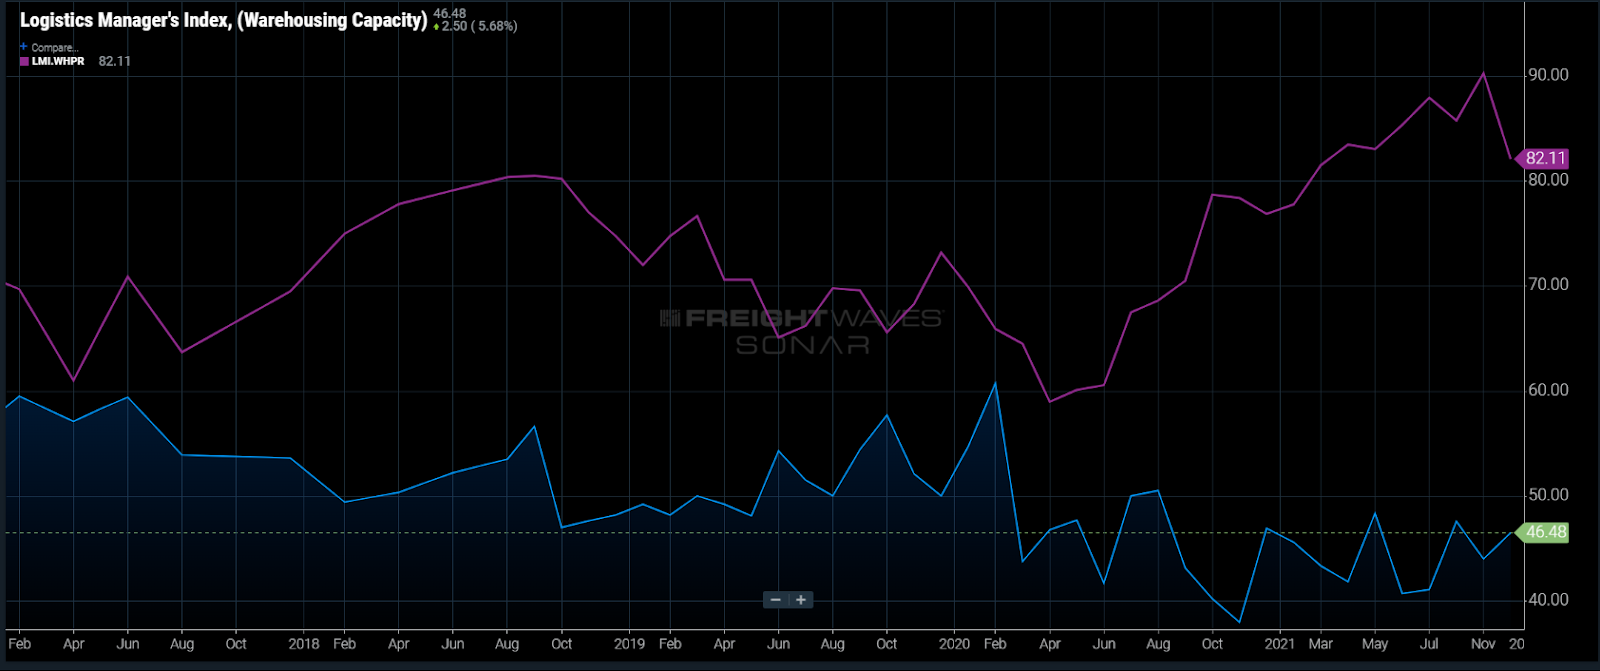
In the longer run, companies have no choice but to consider the implications of international trade relationships. Companies have had to overorder due to concerns about tariffs or scarcity of product for the past three years. The pandemic ordering behavior has driven warehouse prices up as capacity has contracted nearly every month since March of 2020, according to the Logistics Managers’ Index.
War is a terrible thing and there are many consequences much worse than continued supply chain disruptions and inflation. Here’s to hoping for a swift resolution and a positive outcome for the individuals whose lives are in danger through no fault of their own.
About the Chart of the Week
The FreightWaves Chart of the Week is a chart selection from SONAR that provides an interesting data point to describe the state of the freight markets. A chart is chosen from thousands of potential charts on SONAR to help participants visualize the freight market in real time. Each week a Market Expert will post a chart, along with commentary, live on the front page. After that, the Chart of the Week will be archived on FreightWaves.com for future reference.
SONAR aggregates data from hundreds of sources, presenting the data in charts and maps and providing commentary on what freight market experts want to know about the industry in real time.
The FreightWaves data science and product teams are releasing new data sets each week and enhancing the client experience.
To request a SONAR demo, click here.
