


The flow of trade is being derailed out of the ports of Los Angeles and Long Beach as $1.5 billion in trade is landlocked waiting for rail service. A combined 33,484 containers are sitting nine-plus days in San Pedro. This backup is eating up valuable space at the ports, inhibiting the fluidity of trade. The CNBC Supply Chain Heat Map shows the growing congestion at the West Coast ports and the diversion of trade to the East Coast increasing and creating more congestion.
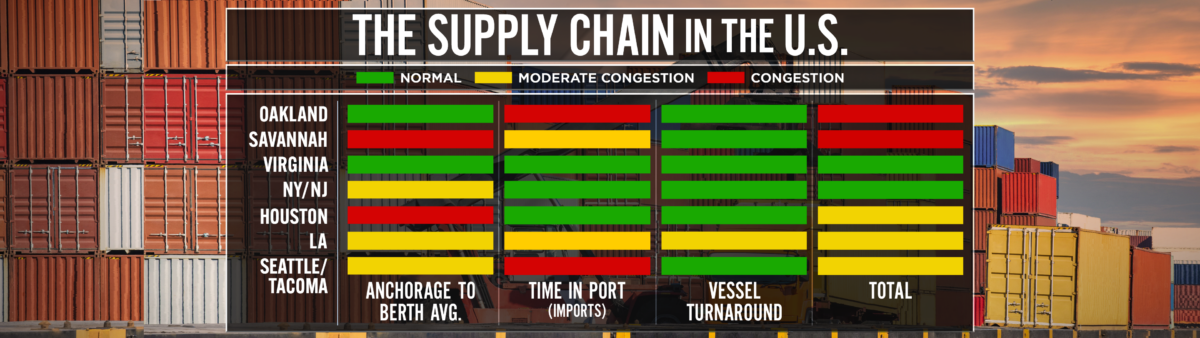
“Rail containers continue to pile up in the ports in record numbers,” said Noel Hacegaba, deputy executive director of administration and operations of the Port of Long Beach. “We need those boxes to move to create more capacity and to keep the economy moving.”
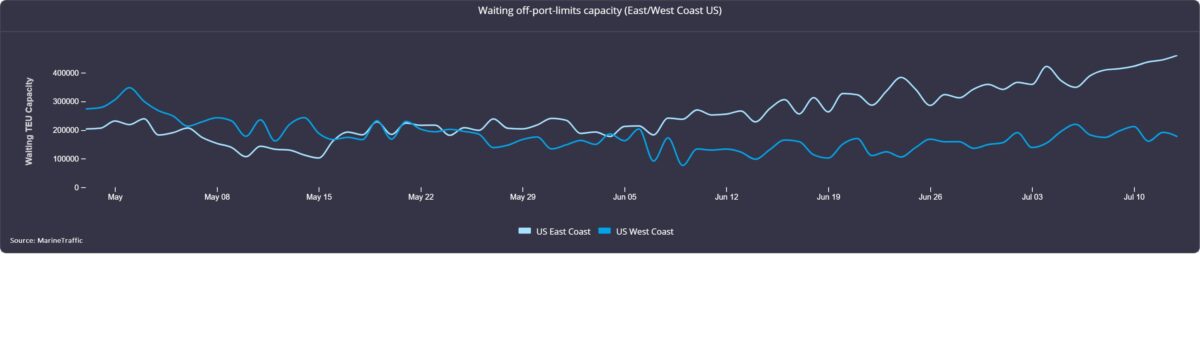
According to MarineTraffic, approximately 460,000 twenty-foot equivalent units were loaded on vessels waiting off the East Coast ports, and 180,000 TEUs were stacked on vessels off the West Coast ports as of Wednesday.
According to Mike Baudendistel, head of Intermodal Solutions at FreightWaves, “While it remains to be seen whether containerized rail intermodal service will be as poor in this year’s third quarter as it was in last year’s third quarter, chassis availability, labor availability and congestion at intermodal facilities and ports are all contributing to subpar intermodal service. Following past recessions, the railroads have been more able to re-hire workers as volume recovered. This time, it’s been more challenging amid historically high employee turnover levels and poor employee morale.”
The buildup of vessels anchored off of each coast is valued at around $30 billion, according to MDS Transmodal.
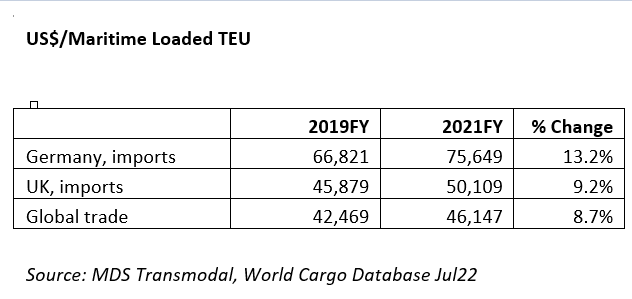
It is important to note the value of the trade includes the inflationary pressures of freight rates.
“The nominal value of goods moved in container has grown by almost 9% between 2019 and 2021,” explained Antonella Teodoro, senior consultant at MDS Transmodal. “Considering that the average annual increase in the previous two years was in the region of 0.7%, it is reasonable to believe that the main cause of the increase estimated in the last two years is the escalation in freight rates.”
Across the pond, the rail and port problems in Germany are just as bad as in the U.S. A 48-hour strike at the Port of Hamburg is crippling trade. This latest strike is further compounding congestion, which is impacting the delivery of U.S. imports by at least two months, according to Crane Worldwide Logistics.
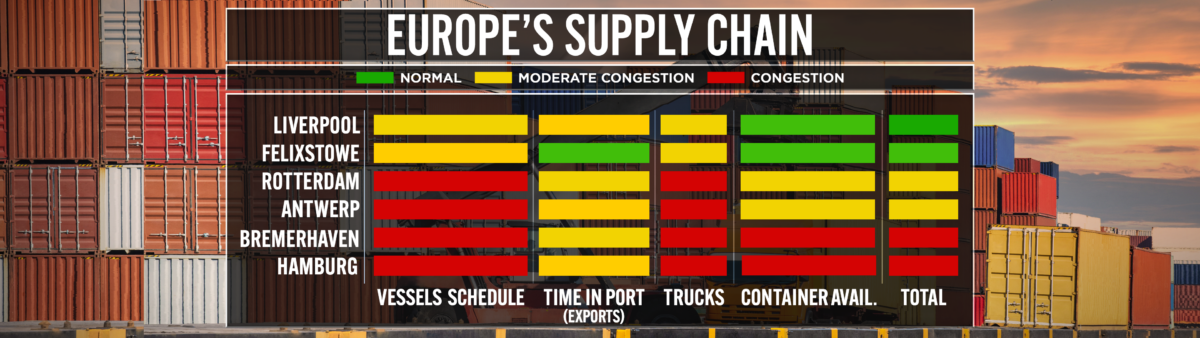
Andreas Braun, Europe, Middle East and Africa Ocean product director at Crane Worldwide Logistics, said the availability of empty containers will impact trade delivery.
“Containers are not easily available at the terminals nor at the inland depots,” Braun said. “Shipping lines are having extreme issues moving empties back on the return leg to Asia. This will worsen the availability of empties in Asia to be filled with exports.”
Braun noted this is all happening before the peak season starts on the Far East westbound trade route.
“Importers in Europe have to expect delays to get their Christmas orders. For the United States, European trade is also being delayed,” he said.
Alex Charvalias, supply chain in-transit visibility lead at MarineTraffic, warned, “A worsening situation in Hamburg with close to 200K TEU waiting for a berth indicates that waiting times will get higher in the coming weeks.”
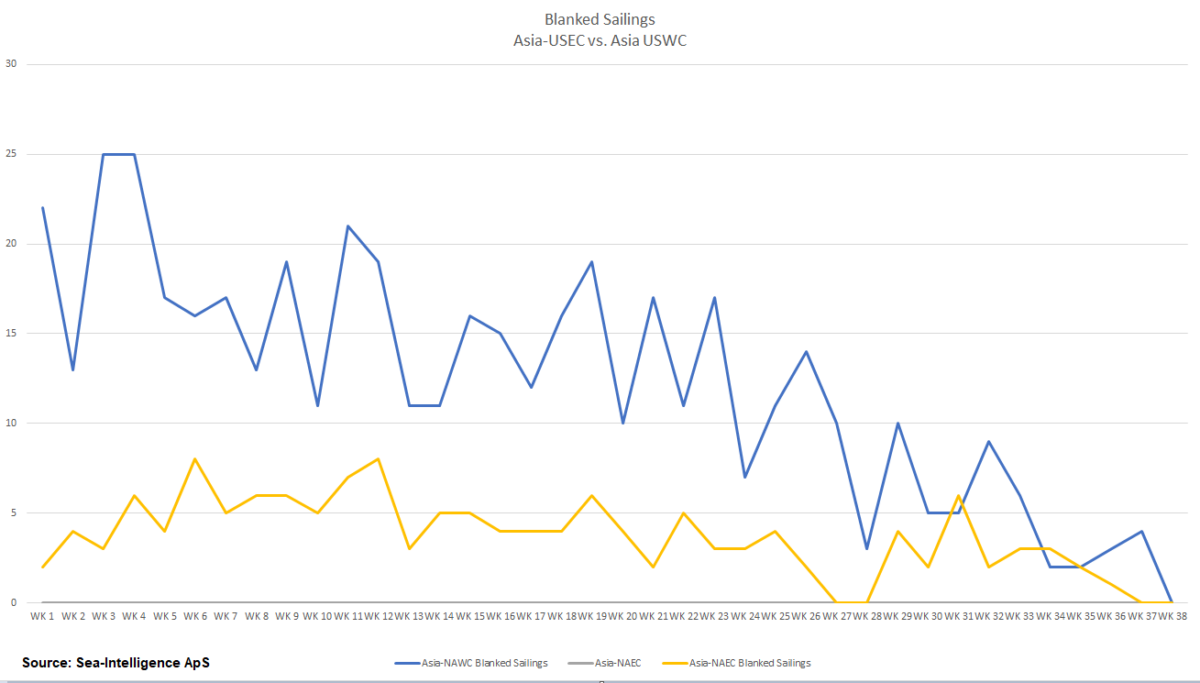
These delays are only going to fuel the possibility of increased blanked sailings. This is something we need to keep an eye on. At present, according to Sea-Intelligence, blank sailings are low, but looking ahead congestion will only grow. Volumes are not waning in August. It is also important to note the increase in blanked sailings would restrict vessel capacity, which could stop the slide in the ocean freight spot rate.
We all know a vessel at rest is not making money. It’s only a matter of time before the blanked sailings tick up to battle the trade sloth.
The CNBC Supply Chain Heat Map data providers are global freight booking platform Freightos, creator of the Freightos Baltic Dry Index; logistics provider OL USA; supply chain intelligence platform FreightWaves; supply chain platform Blume Global; third-party logistics provider Orient Star Group; marine analytics firm MarineTraffic; maritime visibility data company project44; maritime transport data company MDS Transmodal UK; ocean and airfreight benchmarking and analytics firm Xeneta; leading provider of research and analysis firm Sea-Intelligence ApS; Crane Worldwide Logistics; and air and freight logistics provider SEKO Logistics.