


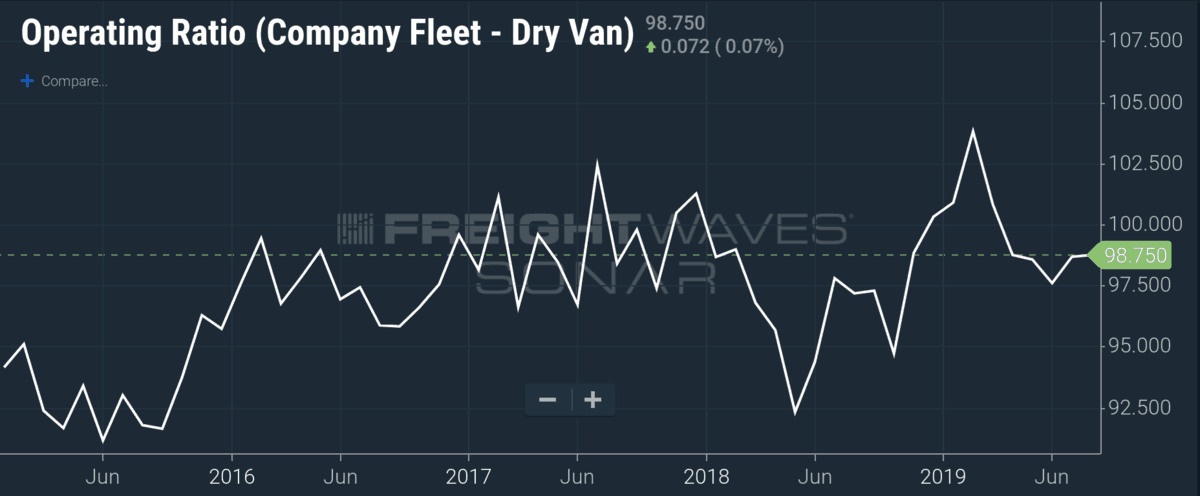
Chart of the Week: Operating Ratio — Dry Van Carriers Company Fleet (SONAR: OPRAT.VCF)
Like travelers walking through the desert that found an oasis, carriers found a wellspring of freight in 2017 and 2018 and expanded their operations. Unfortunately for the carriers, the pool has dried, leaving many dying of thirst. 2019 has been a lesson in how trucking markets can overheat just like the economy, leading to an uncomfortable period of contraction. Operating ratios (ORs) for dry van carriers in the Truckload Carriers Association (TCA) Truckload Indexes program have averaged over 100% since the start of the year as a result of this contracting growth.
In recent weeks there has been a lot of dispute in the media and over Twitter about the state of the trucking market. We’ve described the market as getting “bloody” earlier this year, while others have talked about how “strong” the trucking business is. Recently, we developed a view that the market was about to turn for the better, based on volume data we have seen in the market.
Regardless of the words you use, it is important to inform these views with data. The TCA benchmarking program is the first and only program in the history of truckload that provides monthly benchmarking of hundreds of competitive truckload carriers, ranging from mid-size to enterprise (smallest fleet 75 trucks, largest is 7000). In total, 73,000 trucks are counted in the data sample, representing 8% of the total truck count of medium and large trucking fleets operating in the entire U.S.
The fleets submit monthly financial data into a benchmarking software program that compiles aggregated financial reports for the industry, sliced by a number of variables. While the truckload carriers submit 500+ points of data, only 31 are published in an aggregated basis inside of SONAR. With this data we can use data and not bias to determine how the industry as a whole are doing. Prior to the data being offered on an aggregated basis, the only data points non-insiders would get about the state of the market is through the public truckload carrier earnings reports that would come out quarterly and offer up 8-10 operational KPIs. Now we have over 30 and they come up out monthly from over 200 different fleet profiles.
Operating ratios are a measure of operational efficiency. The formula is operating costs/operating revenue. A 100 OR indicates that for every dollar made in revenue, 100% of it goes to funding the cost of doing business, leaving nothing for debt or investment. In trucking operating costs are things like driver wages, back office support, and maintenance costs. Debt and interest payments are not included in these costs.
Most carriers carry some amount of debt in order to fund some of their growth as many trucking companies are low on cash. Purchasing equipment and buildings are some of the more commonly financed items. In general, many carriers consider making five to ten cents on the dollar a success, or a 90 to 95 OR.
The issue for carriers in 2019 has been more about the oversupply than the lack of demand, although both are present. As carriers saw margins expand in 2018, they decided to invest in growing their fleets as was demonstrated by the record number of class 8 truck orders last year. About the time that most of the orders were being placed the market started to cool. Daily truckload volumes have averaged roughly 3% under 2018 from March through July, but the most brutal hit came in May and June when they were over 4% under previous year volumes.
So far in 2019 over 600 trucking companies have reportedly failed with two larger carriers closing this week. The first carrier, HVH transportation, was owned by a private equity firm and had over 300 trucks. The second was a smaller 100 power unit operation in Georgia.
The trucking industry is extremely competitive with relatively low barriers to entry. All it takes is a commercial driver’s license (CDL), a truck, and a willingness to drive to start a trucking company. Many drivers will quit larger operations to start their own venture after a time. FreightWaves has studied the Federal Motor Carrier Safety Administration (FMCSA) data and found that smaller fleets are still growing when the lager fleets (100+ trucks) have contracted over the past several months.
Many of these drivers have developed relationships with shippers over the years, making them a reliable option. Smaller carriers have lower overhead costs and can drop rates under the larger carriers whose costs are filled with building leases and back office costs. The influx of smaller carriers has a deflationary impact to both spot and contract rates.
In 2017, carrier ORs averaged 99%. Many of the contracted rates were made based on 2016 activity, which was the last freight recession. Seeing as most freight contracts are made on an annual cycle, these rates were in place throughout most of 2017 and early 2018, which kept profit margins low.
Late in 2017 into early 2018, carriers started falling out of their contracted obligations to service higher paying spot market freight. Demand grew so fast that spot rates were well above contract. Carriers, at times, could get more than double the price of hauling for their contracted shippers. The spread between spot and contract was too much to ignore.
Recently, volumes have recovered but have not had significant impact to rates. This should provide relief for some carriers and extend their life for a time, but winter is coming when freight volumes typically plummet. Carriers normally build reserves in the summer to keep them afloat during the slower months. The true test of carrier resolve has yet to come.
About the Chart of the Week
The FreightWaves Chart of the Week is a chart selection from SONAR that provides an interesting data point to describe the state of the freight markets. A chart is chosen from thousands of potential charts on SONAR to help participants visualize the freight market in real-time. Each week a Market Expert will post a chart, along with commentary live on the front-page. After that, the Chart of the Week will be archived on FreightWaves.com for future reference.
SONAR aggregates data from hundreds of sources, presenting the data in charts and maps and providing commentary on what freight market experts want to know about the industry in real time.
The FreightWaves data science and product teams are releasing new data sets each week and enhancing the client experience.
To request a SONAR demo click here.
Trailer Sales Amarillo
King Country Trailer and Repair is a company run by truckers for truckers and therefore we will provide unparalleled levels of customer service and experience.
KCTR has over 30 years’ experience in the trucking industry which has helped us develop a true understanding of what business owners, managers, dispatchers and drivers are looking for in a dealership/service center. Whether you need a call out on a Saturday night or need a courtesy trailer to finish your delivery, KCTR has the resources and desire to be a true partner for you and your trucking company.
Mr. James Caver
Apply now for your personal or business loan with an affordable rate of 3% interest with an 100% Guarantee. Apply now & obtain loan within 48 hours of approval contact the company email:[[email protected]]
Text Or Whatsapp Us: +13346496466
C E
Big Brother Government won’t allow brokerages to Legally give you loads for 90 days,so you pay insurance-license- etc,etc,with no incoming revenue for 90 days. Thank Democrat Government for that rule,CDL handbook states NO English NO CDL