Using data provided to American Shipper by the trade intelligence firm Zepol Corp., we’ll take a closer look at each of these companies in terms of where their cargo originates, where in the United States it’s destined, which liner carriers they use, and how their volumes have trended quarter to quarter.
The series will count down monthly until we analyze the top U.S. inbound NVO in December. Data is derived from Zepol’s database, which uses U.S. Customs data direct from carrier bills of lading as they are entered in the Automated Manifest System.
The top 12 U.S. inbound NVOs for this series were determined based on their total volume in 2011, though the statistics provided by Zepol will be updated monthly so that each NVO will be examined based on the most recent 12-month period – in this case, the period between July 1, 2011 through June 30, 2012.
This month, we’ll examine Apex Shipping, a subsidiary of the San Francisco-based Apex Group.
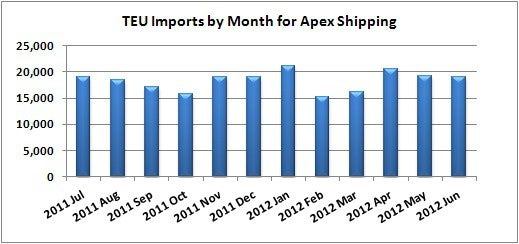
In the latest 12-month period, Apex moved 219,873 TEUs on U.S. inbound trades, an impressive 18.7 percent higher than the preceding 12 month-period.
| Source: Zepol |
Monthly volumes for Apex have hovered in the 15,000- to 20,000-TEU range for the last year, with a high of 21,170 TEUs in January, likely aided by an earlier than usual Lunar New Year in Asia.
Apex is heavily reliant on volumes from Asia’s major exporting nations, with China unsurprisingly at the head of the list. A full two-thirds of Apex’s volume in the past year is from China, with the Southeast Asian triumvirate of Thailand, Indonesia, and Vietnam lagging far behind. Those three contributed 10 percent, 9.1 percent, and 5.6 percent, respectively. Taiwan, Hong Kong and Malaysia contributed another 6.5 percent collectively.
 |
| Source: Zepol |
As for which carriers Apex uses most for U.S. inbound shipments, Maersk accounts for more a quarter of its volume. For the other three-quarters, Apex relies on a fairly large portfolio of carriers. Yang Ming and Mediterranean Shipping Co. move 10.9 percent and 10.5 percent, respectively, and then seven lines each have between 7.4 and 3.3 percent of its volume. Of those, COSCO Container Lines, Hanjin Shipping, PIL, MOL, and Hapag-Lloyd are the most prominent.

|
 |
| (Click to see full-sized charts.) |