The numbers reflect the continuing pull of Asian import cargo from traditional West Coast gateways to the East Coast.
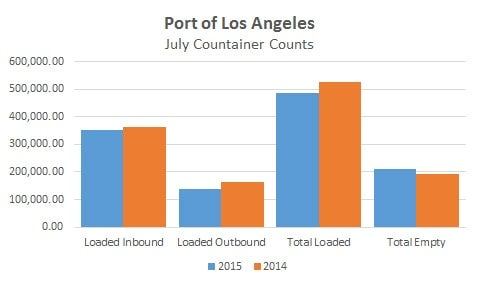
The Port of Los Angeles, the largest U.S. container terminal, said Friday that box volumes fell 2.5 percent last month to 699,127 TEUs compared to July 2014. Exports dropped 16.4 percent to 136,402 standard shipping units, while imports decreased 3.5 percent to 350,627 TEUs. Combined total loaded containers decreased 7.5 percent to 487,029 TEUs. The decreases were offset by 11.2 percent growth in handling of empty containers.
Year-to-date volume in Los Angeles is down 3.5 percent compared to the same period a year ago.
The Oakland port authority on Friday said containerized cargo volume inched up 1 percent in July, with import growth of 8.7 percent year-over-year. Imports have risen five consecutive months in Oakland compared to the same period in 2014. The port handled 1 percent more export cargo last month – the first monthly improvement in Oakland’s exports this year.
The Port of Oakland moved 9 percent fewer empty boxes than it did a year ago.
The recovery in Oakland from the labor strife that sharply reduced port productivity in January and February at West Coast ports has been slowed by a shortage of longshoremen. Some ships waited 36 hours last month for a berth. In recent, weeks, additional dockworkers have joined the labor pool and helped decrease the backlog of vessels, the port authority said.
Box volumes in Oakland plummeted 30 percent in the first two months of 2015. In June, volume dipped 1 percent. For the first seven months of the year, the port has handled 6.3 percent fewer containers than a year ago.
Long Beach, which sits adjacent to the Port of Los Angeles, last week reported that its terminals achieved an 18.4 percent increase in container volumes in July. Overall, the port handled 690,244 TEUs. Import volumes were up 16.2 percent to 345,912 TEUs and exports grew 15.9 percent to 143,875 TEUs, despite currency headwinds.
Import volumes grew an estimated 6 percent in July to 1.59 million TEUs at a dozen major U.S. ports, according to the monthly Global Port Tracker published by the National Retail Federation and Hackett Associates.
For the first half of the year, import volumes at the nation’s major ports are up 6.5 percent to 8.9 million TEUs from the same period in 2014.
Ports on the East Coast and Gulf, by contrast, are enjoying large increases in container volumes. The difference reflects a shift in port preferences by shippers, who have permanently shifted some of their import cargo deliveries from the West Coast because of lingering concerns about ongoing congestion and potential labor disruptions. Instead, cargo owners are using all-water transportation to reach markets in the eastern half of the country. The ports of New York/New Jersey and Norfolk have suffered some of their own congestion problems as a result of the cargo surge over the past year, but southeastern ports have been able to absorb the extra business without much service deterioration – to the satisfaction of shippers.
Research firm Zepol last month released data showing that total containerized imports at East Coast increased by 15 percent during the first half of the year, while traffic on the West Coast fell 4 percent. Most of the growth represents cargo from China.
Brokerage Compliance Symposium
The day before F3. Every compliance issue you face - fraud exposure, carrier liability, FMCSA rules, cargo theft, insurance gaps - navigated by attorneys and operators defining best practices in a changing industry.
F3 Awards Dinner
The night before F3. FreightTech100 companies honored. FreightTech 25 and Shipper of Choice winners revealed live. Cocktail reception into dinner and live music - 300 industry leaders in one purpose-built room.
F3: Future of Freight Festival
Industry-defining keynotes, rapid-fire technology demos, and industry leaders networking in experiences across Chattanooga - plus the inaugural F3 Awards Dinner featuring the FreightTech and Shipper of Choice reveals.
The day before F3. Every compliance issue you face - fraud exposure, carrier liability, FMCSA rules, cargo theft, insurance gaps - navigated by attorneys and operators defining best practices in a changing industry.
The Signal at Chattanooga Choo Choo • Chattanooga, TN Register NowThe night before F3. FreightTech100 companies honored. FreightTech 25 and Shipper of Choice winners revealed live. Cocktail reception into dinner and live music - 300 industry leaders in one purpose-built room.
The Signal at Chattanooga Choo Choo • Chattanooga, TN Register NowIndustry-defining keynotes, rapid-fire technology demos, and industry leaders networking in experiences across Chattanooga - plus the inaugural F3 Awards Dinner featuring the FreightTech and Shipper of Choice reveals.
The Signal at Chattanooga Choo Choo • Chattanooga, TN Register Now