Using data provided to American Shipper by the trade intelligence firm Zepol Corp., we’ll take a closer look at each of these companies in terms of where their cargo originates, where in the United States it’s destined, which liner carriers they use, and how their volumes have trended quarter to quarter.
The series will count down monthly until we analyze the top U.S. inbound NVO in December. Data is derived from Zepol’s database, which uses U.S. Customs data direct from carrier bills of lading as they are entered in the Automated Manifest System.
The top 12 U.S. inbound NVOs for this series were determined based on their total volume in 2011, though the statistics provided by Zepol will be updated monthly so that each NVO will be examined based on the most recent 12-month period – in this case, the period between Oct. 1, 2011 through Sept. 30, 2012.
This month, we’ll examine Phoenix International, the Illinois-based global freight forwarder that was recently acquired by the Minneapolis-based 3PL C.H. Robinson.
The deal, despite the gaudy purchase price, was lauded by analysts because of Phoenix’s robust volume, a point made clear by Phoenix’s ranking on this list.
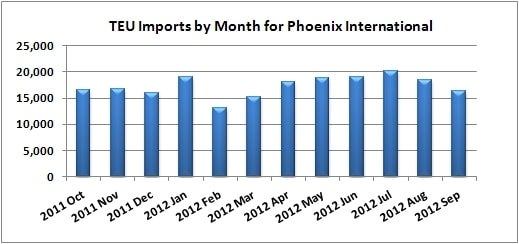
In the last 12 months, Phoenix’s U.S. inbound volume was 207,646 TEUs, an increase of 5.7 percent over the previous 12-month period.
| Source: Zepol |
 |
| Source: Zepol |
The next four biggest gateways are all on the East Coast, with New York/New Jersey followed by Savannah, Charleston, and Norfolk. Incidentally, Phoenix’s volume share into Seattle is the highest of any of the NVOs surveyed on our Top 12 list so far.
Phoenix uses a diverse basket of ocean carriers for its inbound shipments, with eight different lines carrying at least 5.8 percent of its volume. The biggest three are Yang Ming (14.3 percent), APL (12.2 percent), and Mediterranean Shipping Co. (11.2 percent). OOCL (11 percent) and COSCO Container Lines (10.4 percent) also handle a significant amount of volume and are followed closely by China Shipping, NYK Line, and Hyundai Merchant Marine. Maersk Line is notable for their absence among Phoenix’s top 10 carriers, while major European lines CMA CGM and Hapag-Lloyd are ninth and 10th, perhaps reflecting Phoenix’s emphasis on Asia-North America trade.

|
 |
| (Click to see full-sized charts.) |