
After setting one record high after another in the early weeks of 2018, the weekly DAT Dry Van and Reefer Barometers have finally pulled back slightly, before stabilizing in a strong growth range. Meanwhile the weekly DAT Flatbed Barometer has continued to set one new record high after another. All three modes of truckload trucking are reflecting an environment in which demand exceeds capacity by a wide margin.
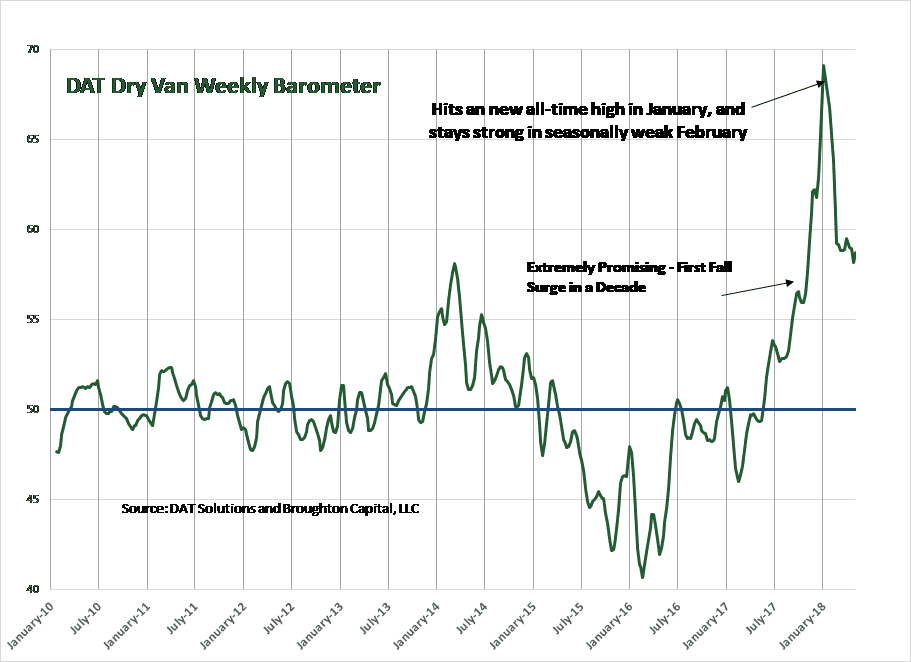
The Dry Van Weekly Barometer is predicting stronger contract pricing in coming months. Even though it has pulled back slightly from extreme highs, it continues to reflect one of the highest levels of demand in excess of capacity in the history of the barometer.
Similar to Dry Van, the DAT Reefer Weekly Barometer is also now predicting stronger contract pricing in coming months. Even though it has pulled back slightly from extreme highs, it continues to reflect one of the highest levels of demand in excess of capacity in the history of the barometer.
The DAT Flatbed Weekly Barometer is predicting extra-ordinary levels of contract pricing in coming months. It has moved ever higher and last week set yet another record high.

The monthly barometers are reflecting the same imbalance between capacity and demand as the weekly barometers, and offer a less volatile and longer-term view.
As we begin to assess what these barometers are telling us, we should remind readers of a fundamental rule of all marketplaces: Volume Leads. We have repeatedly observed in a host of different markets that volume goes up before pricing starts to improve and volume goes down before pricing starts to weaken. Even in markets as basic as the weather, the number of hours of sunshine (sunrise to sunset) starts to decline long before the temperature starts to fall, and the number of hours of sunshine starts to increase long before the temperature starts to rise.
What does all this mean?
- measuring the volume, the number of trucks posted or loads posted means something.
- measuring the volume, the number of trucks searched for or loads searched for also means something.
- measuring the relationship between these marketplace participants, and the volume of each of these actions they are taking, means something even more.
- using the database with most participants and the most volume is invaluable.
- studying all these dynamics collectively and seeing how they have predicted the direction and magnitude of pricing, is (as they say in the MasterCard commercials) priceless.
For each mode (Dry Van, Reefer, and Flatbed) we have constructed the index to function similar to the ISM indices in that a value of 50 serves as the value of “neutral” or “in-balance.” Values above 50 indicate that demand exceeds capacity, while values below 50 indicate that capacity exceeds demand. Magnitude matters, i.e., 56 is better than 54, and 42 is worse than 48.
The DAT Dry Van Barometer
Weekly – after breaking equilibrium (50) forty-five weeks ago, the weekly barometer established a succession of ever-higher levels. Although the current reading of 59.0 is not at the extreme levels of capacity tightness experienced in late January and early February (above 65.0), there are still far more loads than trucks in most lanes in most parts of the country. The Barometer’s high level for this recovery is notable on a stand-alone basis but becomes even more remarkable when seasonality is considered (February is the weakest freight month and January is the second weakest freight month). This level, coupled with the first fall surge in freight in over a decade and the ELD rule (effective December 18th), should bode well for carriers seeking higher pricing in the 2018 bid season. The Dry Van Weekly Barometer continues to predict stronger contract pricing in coming months.
Exhibit 1

We have had questions about the historical track record of the DAT Freight Barometers and the predictive value. We assert that this proprietary method of weighing the balance between demand and capacity predicts both the direction and magnitude of changes in spot pricing. We also assert that the direction, magnitude, and duration of changes in spot pricing, predict the direction and magnitude of changes in contract pricing.
Exhibit 2

Plotting the nominal spot price against the Barometer illustrates the predictive value.
Exhibit 3

The % change in spot vs. the Barometer shows the predictive value even more clearly.
The spot price is predictive of the contract price, and we find the gap between the spot price and the contract price useful in assessing / predicting the margins reported by most of the large publicly held truck brokers, and the logistics divisions of asset-based truckers. We should note that the spot price, after being above the contract price in December, January, and most of February, is back below contract. This is more a function of the increase in contract price than a reduction in the spot price.
Exhibit 4

As most industry participants know, spot leads contract on the way up and down.
The DAT Reefer Barometer
Weekly – At 57.9 it is above 50 for the forty-forth week in a row. Similar to the Dry Van segment, the current reading is not at the extreme levels of capacity tightness experienced in late January and early February (above 65.0), but there are still far more loads than trucks in most lanes in most parts of the country. The current level of DAT Reefer Weekly Barometer is predicting contract stronger pricing in coming months.
Exhibit 5

As we have pointed out for Dry Van, there is a clear pattern in which the DAT Barometer leads the spot price, which leads the contract price. We assert that our proprietary method of weighing the balance between demand and capacity using DAT’s unrivaled database predicts both the direction and magnitude of changes in spot pricing. We also assert that the direction, magnitude, and duration of changes in spot pricing, predict the direction and magnitude of changes in contract pricing. The following below display this pattern for the Reefer mode.
Exhibit 6

Similar to dry van, the barometer predicts the direction and magnitude of changes in the spot price for reefer.
Exhibit 7

The % change in spot vs. the Barometer shows the predictive value even more clearly.
Exhibit 8

As most industry participants know, spot leads contract on the way up and down
The DAT Flatbed Barometer
Weekly – came in at 86.1, establishing yet another record high and accelerating in a manner even stronger than dry van and reefer. The DAT Flatbed Barometer has now been above equilibrium (50) for fifty-three consecutive weeks. The metric originally broke through 50 in early March of 2017 as the rise in the price of crude back above $50 a barrel drove an increase in heavy industrial activity that began in October of 2016, and continued to improve as WTI oil stayed above $45 a barrel (above $63 as we write this). Hurricanes Harvey and Irma started a strong uptick in building material shipments, but that strength has been continued by an oil price that makes fracking profitable in most parts of the U.S. and the high level of flatbed activity that fracking drives. We see the current level of flatbed activity as evidence that the U.S. industrial economy has shifted into high gear.
Exhibit 9

As we have pointed out for Dry Van and Reefer, there is also a clear pattern for Flatbed in which the DAT Barometer leads the spot price, which leads the contract price. We assert that our proprietary method of weighing the balance between demand and capacity using DAT’s unrivaled database predicts both the direction and magnitude of changes in spot pricing. We also assert that the direction, magnitude, and duration of changes in spot pricing, predict the direction and magnitude of changes in contract pricing. The following charts display this pattern for the Flatbed mode.
Exhibit 10

Again, the barometer leads the nominal spot price.
Exhibit 11

Again, the pattern becomes even more clear when plotted against the % delta.
Exhibit 12

Unlike Dry Van, spot prices are still well above contract in Flatbed.
Brokerage Compliance Symposium
The day before F3. Every compliance issue you face - fraud exposure, carrier liability, FMCSA rules, cargo theft, insurance gaps - navigated by attorneys and operators defining best practices in a changing industry.
F3 Awards Dinner
The night before F3. FreightTech100 companies honored. FreightTech 25 and Shipper of Choice winners revealed live. Cocktail reception into dinner and live music - 300 industry leaders in one purpose-built room.
F3: Future of Freight Festival
Industry-defining keynotes, rapid-fire technology demos, and industry leaders networking in experiences across Chattanooga - plus the inaugural F3 Awards Dinner featuring the FreightTech and Shipper of Choice reveals.
The day before F3. Every compliance issue you face - fraud exposure, carrier liability, FMCSA rules, cargo theft, insurance gaps - navigated by attorneys and operators defining best practices in a changing industry.
The Signal at Chattanooga Choo Choo • Chattanooga, TN Register NowThe night before F3. FreightTech100 companies honored. FreightTech 25 and Shipper of Choice winners revealed live. Cocktail reception into dinner and live music - 300 industry leaders in one purpose-built room.
The Signal at Chattanooga Choo Choo • Chattanooga, TN Register NowIndustry-defining keynotes, rapid-fire technology demos, and industry leaders networking in experiences across Chattanooga - plus the inaugural F3 Awards Dinner featuring the FreightTech and Shipper of Choice reveals.
The Signal at Chattanooga Choo Choo • Chattanooga, TN Register Now