By Eric Johnson
Welcome to the third installment of our yearlong countdown of the top 12 non-vessel-operating common carriers for U.S. inbound containerized cargo.
Using data provided to American Shipper by the trade intelligence firm Zepol Corp., we’ll take a closer look at each of these companies in terms of where their cargo originates, where in the United States it’s destined, which liner carriers they use, and how their volumes have trended quarter to quarter.
The series will count down monthly until we analyze the top U.S. inbound NVO in December. Data is derived from Zepol’s database, which uses U.S. Customs data direct from carrier bills of lading as they are entered in the Automated Manifest System.
The top 12 U.S. inbound NVOs for this series were determined based on their total volume in 2011, though the statistics provided by Zepol will be updated monthly so that each NVO will be examined based on the most recent 12-month period.
This month, we’ll look at Hecny Shipping, a Hong Kong-based NVO that’s part of the Hecny Group, a half-century-old transportation company.
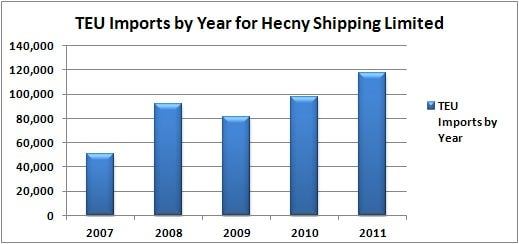
In the 12-month period from March 2011 through February 2012, Hecny moved 117,410 TEUs on U.S. inbound trades. The NVO’s volume in calendar year 2011 rose 20.1 percent over 2010, to 117,478 TEUs.
In Hecny’s case, 85.1 percent of its U.S. inbound volume in the past 12 months has originated in China. If you include Hong Kong origins, the number jumps to 88.9 percent. Only Vietnam, and to a lesser extent Indonesia and Thailand, are appreciable secondary origin points for Hecny cargo.
 |
However, volume in February from Hecny was almost identical at the two ports (1,442 TEUs at Long Beach, and 1,441 TEUs at Los Angeles). That speaks to a gradual decline of Hecny’s imports through Long Beach in the second half of 2011 – in August, Long Beach handled 5,713 TEUs of Hecny imports, and the NVO’s volume through the port decreased in all but one of the next six months.
The Port of New York/New Jersey was the third largest destination for Hecny’s imports, at 20,414 TEUs in the last 12 months.
Mediterranean Shipping Co. and Maersk Line were far the biggest providers of ocean service for Hecny’s cargo, with the two European giants accounting for 64,362 TEUs in the last 12 months (or just short of 55 percent of Hecny’s total volume).
Maersk’s share of Hecny’s cargo has increased in the last year, while MSC’s has declined. In June 2011, MSC carried 3,377 TEUs (or 32.1 percent) of the NVO’s volume, while Maersk carried 1,357 TEUs, or 12.9 percent. By October, however, Maersk was carrying more of Hecny’s cargo than MSC and has done so each of the last five months (in January they carried the exact same amount).
UASC, “K” Line, Grand China Shipping, and COSCO Container Lines collectively accounted for another 28,573 TEUs (or 24.3 percent of Hecny’s total volume).
  (Click to see full-sized charts.) |