Using data provided to American Shipper by the trade intelligence firm Zepol Corp., we’ll take a closer look at each of these companies in terms of where their cargo originates, where in the United States it’s destined, which liner carriers they use, and how their volumes have trended quarter to quarter.
The series will count down monthly until we analyze the top U.S. inbound NVO in December. Data is derived from Zepol’s database, which uses U.S. Customs data direct from carrier bills of lading as they are entered in the Automated Manifest System.
The top 12 U.S. inbound NVOs for this series were determined based on their total volume in 2011, though the statistics provided by Zepol will be updated monthly so that each NVO will be examined based on the most recent 12-month period – in this case, the period between Sept. 1, 2011 through Aug. 31, 2012.
This month, we’ll examine Danmar Lines, the in-house NVO for global logistics giant DHL.
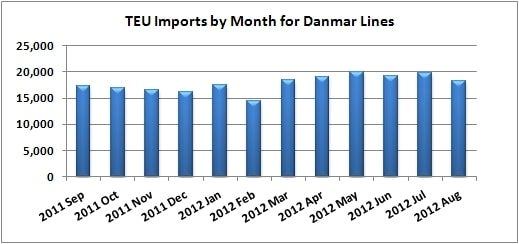
Danmar’s inbound U.S. volume in the last 12 months has climbed 6.1 percent over the prior 12-month period, to 214,146 TEUs. In calendar year 2011, the NVO had volume of 201,134 TEUs. Volume has held steady throughout the year, with a particularly strong May-July period.
| Source: Zepol |
Perhaps unsurprisingly, DHL’s home market of Germany is the second biggest origin of U.S. inbound volume for Danmar – at 9.8 percent. Hong Brazil, and Italy round out the top five origin markets, with each contributing less than 5 percent of Danmar’s volume in the last 12 months, again emphasizing its global diversification.
 |
| Source: Zepol |
Norfolk is another key port for Danmar, with 8.8 percent of its volume handled there. Charleston, at 6.4 percent, rounds out the top five.
In terms of which liner carriers Danmar uses for its shipments, compatriot line Hapag-Lloyd is the favorite, with 21.9 percent of its volume. Following that are Mediterranean Shipping Co. and Maersk Line, with 11.8 and 11.6 percent, respectively. The comes Hanjin Shipping 8.9 percent, CMA CGM at 7.4 percent, and NYK Line at 7.2 percent.

|
 |
| (Click to see full-sized charts.) |