Using data provided to American Shipper by the trade intelligence firm Zepol Corp., we’ll take a closer look at each of these companies in terms of where their cargo originates, where in the United States it’s destined, which liner carriers they use, and how their volumes have trended quarter to quarter.
The series will count down monthly until we analyze the top U.S. inbound NVO in December. Data is derived from Zepol’s database, which uses U.S. Customs data direct from carrier bills of lading as they are entered in the Automated Manifest System.
The top 12 U.S. inbound NVOs for this series were determined based on their total volume in 2011, though the statistics provided by Zepol will be updated monthly so that each NVO will be examined based on the most recent 12-month period – in this case, the period between June 1, 2011 through May 31, 2012.
This month, we’ll examine SCHENKERocean Ltd., a German NVO and subsidiary of the DB Schenker Group.
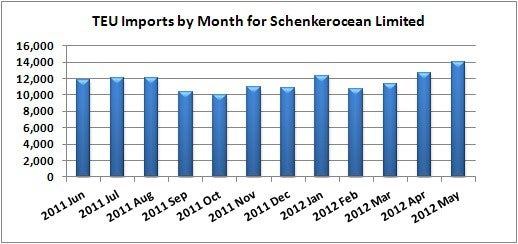
In the latest 12-month period SCHENKERocean moved 139,162 TEUs on U.S. inbound trades, a 3.9 percent increase in volume from the previous 12-month period. In 2011, the NVO’s total U.S. import volume rose 1.2 percent from 2010.
| Source: Zepol |
Unlike all of the previous NVOs examined by American Shipper in this series, SCHENKERocean’s U.S. inbound business is not overwhelmingly reliant on Chinese exports. Just less than 36 percent of its volume came from China. For comparison, SeaMaster Logistics, the No. 8 NVO, has 70 percent of volume originating in China.
Little surprise that Germany is the second biggest source of inbound U.S. volume for German-owned SCHENKERocean, with 13.6 percent of its volume coming from there. The Netherlands and Italy were the third and fourth largest sources of volume, emphasizing the European lean of SCHENKERocean’s business. Vietnam. Rounding out the top five was Vietnam, though there was also healthy contributions from Austria, Belgium, and France.
With an emphasis on European origin points, it’s not shocking that New York/New Jersey is at the top of the list of U.S. ports of arrival for SCHENKERocean freight. Of the six NVOs surveyed so far by American Shipper, it’s the first time the top port has not been either Los Angeles or Long Beach.
 |
| Source: Zepol |
It underscores SCHENKERocean’s lack of reliance on the transpacific trade. Savannah is the fourth largest port of arrival, with Oakland fifth.
As for which carriers SCHENKERocean uses most for U.S. inbound shipments, the tilt toward European lines is evident. The most favored carrier is compatriot line Hapag-Lloyd, which handled 31.7 percent of its volume in the past 12 months. The second most used line was CMA CGM, which handled 14.7 percent of its volume. After that comes Maersk Line (12.9 percent), APL (5.7 percent), and Hyundai Merchant Marine (4.8 percent).
Mediterranean Shipping Co. comes in at sixth, meaning four of SCHENKERocean’s top six lines are Europe-based, with nearly two-third of its U.S. inbound volumes riding aboard those four carriers’ services.

|
 |
| (Click to see full-sized charts.) |