
We’re regularly enhancing and improving SONAR to meet the needs of the ever-changing freight market and the needs of our customers. To help keep SONAR users informed, we deliver a brief recap of newly released data sets, market indices, and product feature improvements in our This Week in SONAR series.
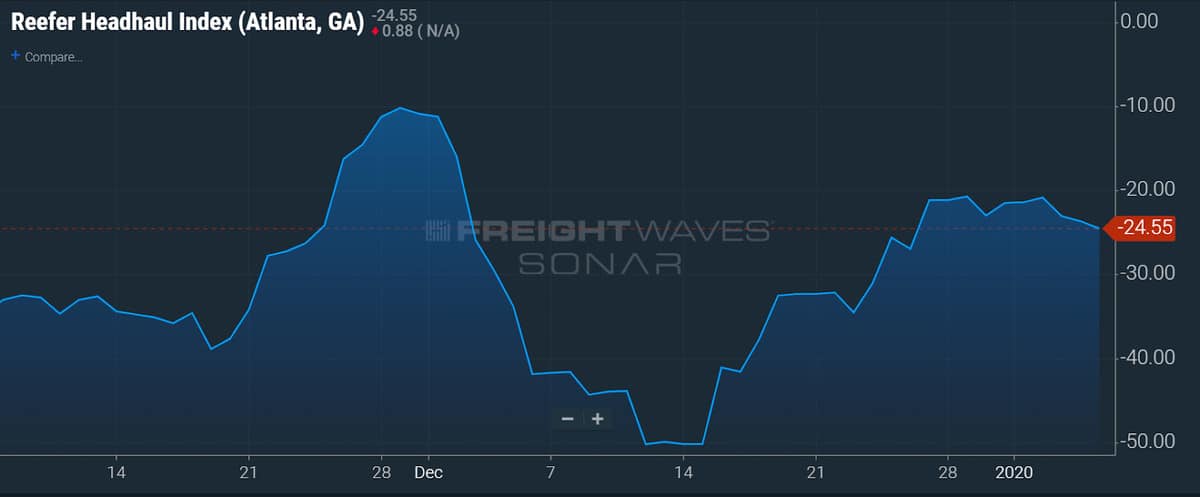
Reefer Headhaul Index, Donny Gilbert, Market Expert, FreightWaves: The Reefer Headhaul Index (RHAUL) measures the difference between the Reefer Outbound Tender Volume Index (ROTVI) and the Reefer Inbound Tender Volume Index (RITVI). The Reefer Headhaul Index is a key indicator of capacity changes for refrigerated equipment in each market. If a user wants to see the reefer headhaul index for the Atlanta market, they would simply type RHAUL.ATL into a SONAR chart to view the trends and changes in the reefer headhaul score. If the spread between ROTVI and RITVI increases, it could indicate capacity may be tightening in a market. Negative headhaul scores can indicate a market is a backhaul market with more inbound trucks than outbound loads.
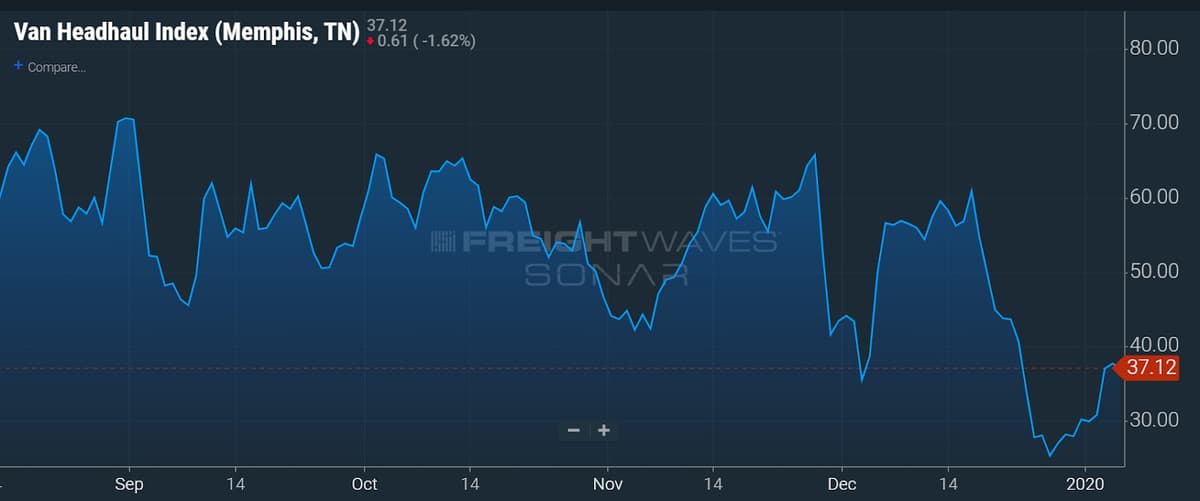
Dry Van Headhaul Index, Donny Gilbert, Market Expert, FreightWaves: The Dry Van Headhaul Index (VHAUL) measures the difference between the Dry Van Outbound Tender Volume Index (VOTVI) and the Dry Van Inbound Tender Volume Index (VITVI). The Dry Van Headhaul Index is a key indicator of capacity changes for dry van equipment in each market. If a user wants to see the dry van headhaul index for the Memphis market, they would simply type RHAUL.MEM into a SONAR chart to view the trends and changes in the dry van headhaul score. If the spread between VOTVI and VITVI increases, it could indicate capacity may be tightening in a market. Negative headhaul scores can indicate a market is a backhaul market with more inbound trucks than outbound loads.
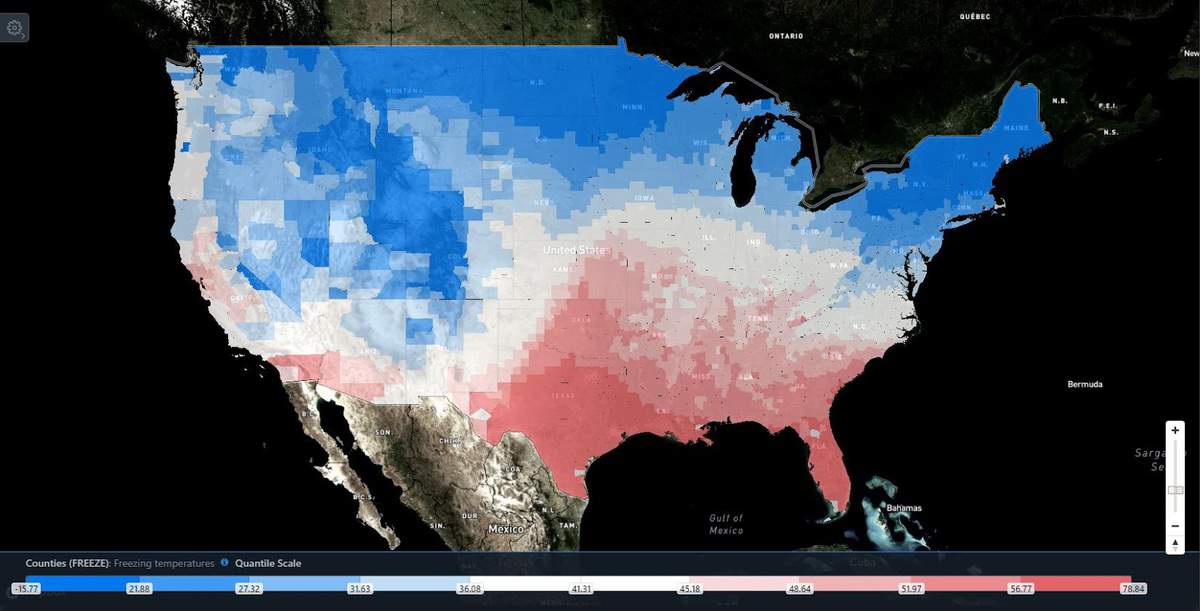
Predictive Freeze Index, Nick Austin, Meteorologist, FreightWaves: The Predictive Freeze Index (FREEZE) is the predicted daily average temperature for each of the 3,000+ counties and parishes in the continental U.S. for the 24-hours from midnight to 11:59:59 p.m. Temperatures are measured at multiple observation sites in each county and parish.
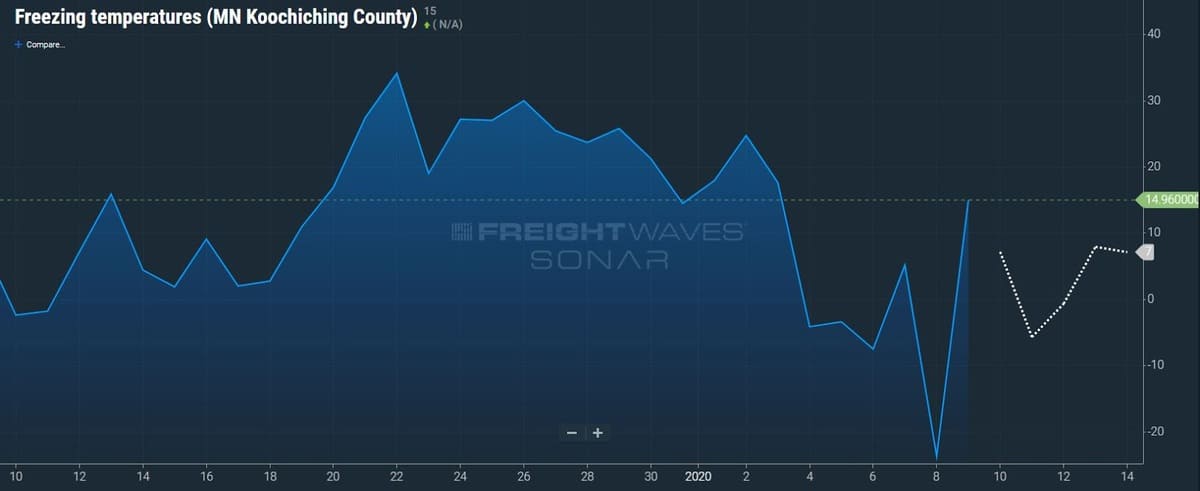
Carriers can use FREEZE to determine where large regions of freezing/below freezing weather may affect their protect-from-freeze (PFF) procedures if they have reefers in their fleets. They can also use the index, in conjunction with the RAIN index, to determine if freezing rain may result in icy roads. The FREEZE index also includes historical data of actual observed daily average temperatures. It can be viewed in map form, or chart form for an individual county.
Air Cargo Volume Index, Justin Childress, Data Scientist, FreightWaves: The Air Cargo Volume Indices represent total air freight and mail volumes moved monthly, broken down by inbound and outbound traffic with additional breakdowns to isolate freight moved via belly cargo in passenger planes or via freighter aircraft. The data can be viewed by individual airports or by lanes. If a user was interested in the historic movement of cargo out of JFK airport, they would type OAIRVOL.JFK into a SONAR chart. For further breakdowns into passenger or freighter movements they could also compare that with OAIRVOLP.JFK and OAIRVOLF.JFK.
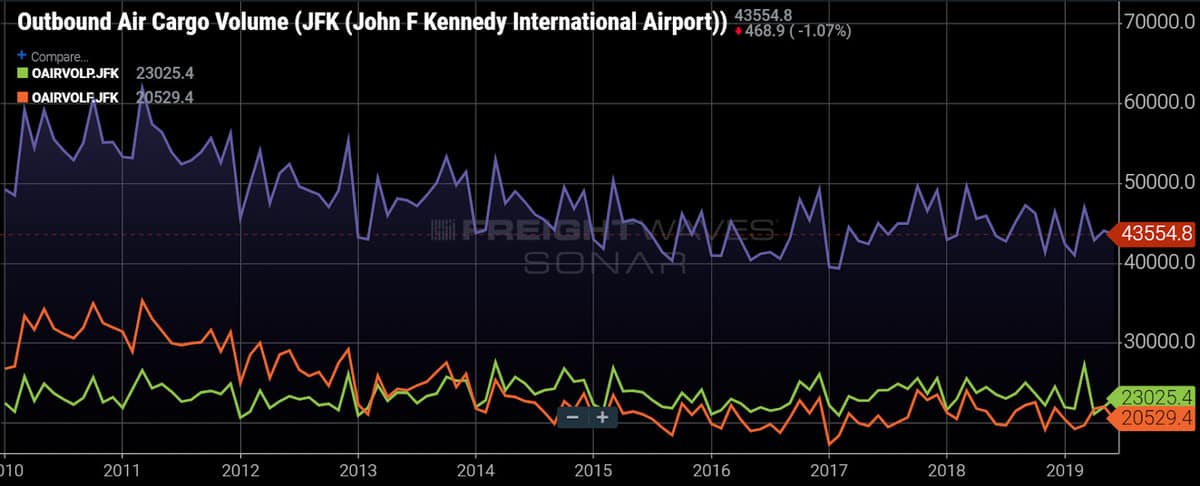
A user could also examine freight movement by lane by adding another airport to the ticker, for example OAIRVOL.JFKATL would represent the total freight movement from JFK airport to ATL airport. These data only refer to USA based freight movement. While OAIRVOL.JFK and IAIRVOL.JFK reflect all freight movements from or to JFK, those same tickers for LHR will only reflect traffic that’s originating or terminating in the United States.
Users competing with air freight for specific goods will be interested to know which airports move the most freight and where there may be opportunities to offer alternatives to shippers. Similarly, users who handle a great deal of last mile shipments will be interested to know which airports historically received the most freight.
A comprehensive list of new Air Cargo Volume tickers is listed below:
- OAIRVOL – Monthly Outbound Air Freight and Mail Volume in (Metric) Tons
- OAIRVOLF- Monthly Outbound Air Freight and Mail Volume by Freighters in (Metric) Tons
- OAIRVOLP – Monthly Outbound Air Freight and Mail Volume by Passenger Planes in (Metric) Tons
- IAIRVOL – Monthly Inbound Air Freight and Mail Volume in (Metric) Tons
- IAIRVOLF – Monthly Inbound Air Freight and Mail Volume by Freighters in (Metric) Tons
- IAIRVOLP – Monthly Inbound Air Freight and Mail Volume by Passenger Planes in (Metric) Tons
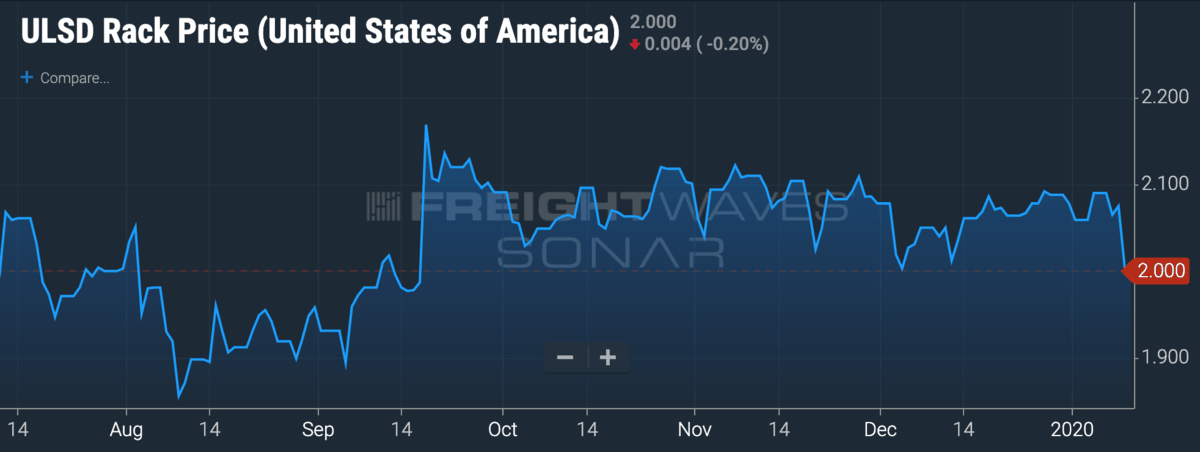
Ultra Low Sulfur Diesel Rack Price (ULSDR), Daniel Pickett, Chief Data Scientist, FreightWaves: We have been reporting ULSDR with the prior day’s effective date. The rate we have been reporting is actually the rate that is in effect for the current day. While no data points are truly changing, API customers may notice that it will look like historical records have changed. In truth, they’ve simply had their “effective date” moved one day forward.
It is important for diesel buyers to note that various payment processors have different practices on when they update the rate they are charging carriers who have negotiated rack+ based pricing. Carriers using SONAR’s diesel price data should work with their fuelcard processor to determine what time Diesel Rates are repriced.
Features: There are 3 new features in SONAR this weekend:
- The ability to enter a custom fuel surcharge in the Rate Predictor Tool in 3D Maps
- Market Volatility is now available on the 3D Maps Beta
- We’ve added a way to search for Airplanes and Vessels. The planes are searchable by flight number, tail number, and origin/destination Airport Codes. The vessels are searchable by ship name, IMO, and MMSI.
All previous SONAR release notes are available HERE. Learn more by using Sue Says in SONAR and clicking on the orca! If you have any questions, please reach out to your Customer Success rep or email sonarsupport@www.freightwaves.com.
SONAR is the fastest and most comprehensive freight market data and analytics platform in the world. These are just a few of the hundreds of unique data sets available to SONAR subscribers. Not a SONAR user yet? Sign up for a free test drive here.
Brokerage Compliance Symposium
The day before F3. Every compliance issue you face - fraud exposure, carrier liability, FMCSA rules, cargo theft, insurance gaps - navigated by attorneys and operators defining best practices in a changing industry.
F3 Awards Dinner
The night before F3. FreightTech100 companies honored. FreightTech 25 and Shipper of Choice winners revealed live. Cocktail reception into dinner and live music - 300 industry leaders in one purpose-built room.
F3: Future of Freight Festival
Industry-defining keynotes, rapid-fire technology demos, and industry leaders networking in experiences across Chattanooga - plus the inaugural F3 Awards Dinner featuring the FreightTech and Shipper of Choice reveals.
The day before F3. Every compliance issue you face - fraud exposure, carrier liability, FMCSA rules, cargo theft, insurance gaps - navigated by attorneys and operators defining best practices in a changing industry.
The Signal at Chattanooga Choo Choo • Chattanooga, TN Register NowThe night before F3. FreightTech100 companies honored. FreightTech 25 and Shipper of Choice winners revealed live. Cocktail reception into dinner and live music - 300 industry leaders in one purpose-built room.
The Signal at Chattanooga Choo Choo • Chattanooga, TN Register NowIndustry-defining keynotes, rapid-fire technology demos, and industry leaders networking in experiences across Chattanooga - plus the inaugural F3 Awards Dinner featuring the FreightTech and Shipper of Choice reveals.
The Signal at Chattanooga Choo Choo • Chattanooga, TN Register Now