Wall Street traders panic. SONAR data shows why they are wrong.
Wall Street is in a panic over fears that the truckload sector has peaked. Wall Street is wrong. We break down the reasons using data from SONAR.
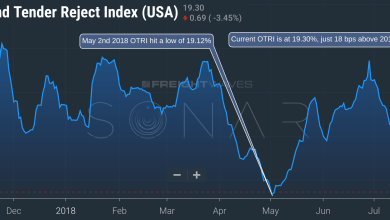
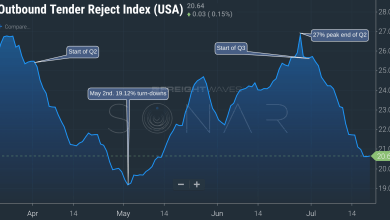
Tender rejections continue to fall towards the May 2nd low, indicating that capacity is loosening in the market. If it reaches the critical level of 19.12%, it could mean that the rest of the summer will be disappointing for carriers that reported a bullish summer outlook.
July has started off slower than carriers would like, showing normal freight patterns. Softer demand is also impacting utilization in the market.
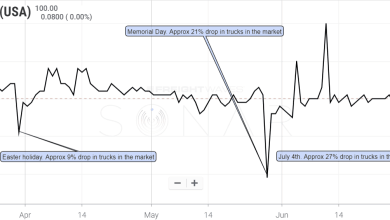
Holidays have a huge impact on the freight markets, with drivers going off-duty and altering their work schedules. In this chart of the week, we examined how different holidays impacted available capacity.
The Freightos Baltic Container Price Index shows the volatility of container prices out of China to the North American West Coast as importers try to adjust to a new era of global trade.
The Cass Shipment Index (CFIS.USA) is showing freight market volumes that are nearly as strong as the 2006 peak season. This is a bullish sign for the second half of 2018.
SOURCE: FREIGHTWAVES SONAR DISPLAYING THE CASS FREIGHT VOLUME INDEX 2018 is shaping up to be the highest freight volume market in over a decade according to the Cass Freight Index (CFIS.USA) on SONAR. The index is currently showing 1.31, up from 1.17 a year ago. This is a great sign for carriers moving into the second […]