Chart of the Week: LTL Monthly Cost per Hundredweight, Van Contract Rate Per Mile Initial Report – USA SONAR: LTL.USA, VCRPM1.USA
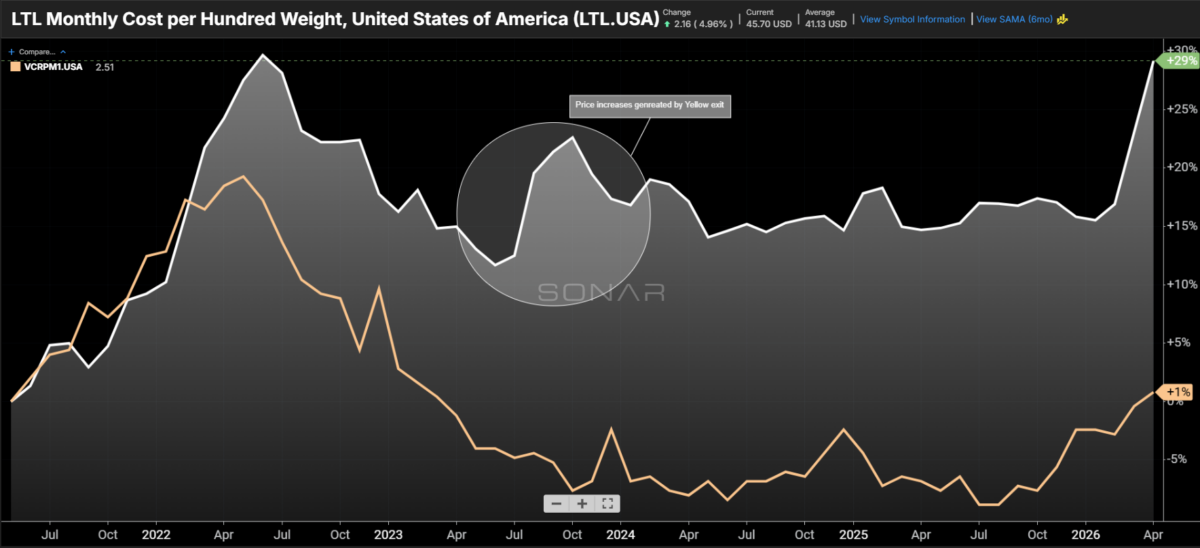
After a fairly sluggish start to the year, less-than-truckload (LTL) rates are now showing the highest levels of upward pressure since the exit of Yellow in the summer of 2023.
The LTL monthly cost per hundredweight index measures pricing change momentum in the LTL market. This index tracks directional changes in the LTL pricing environment based on transactional data.
This does not necessarily mean that all contracts increased simultaneously, but that as new bids and general rate increases work through the market, they are being priced at roughly 12.5% higher levels than at this point last year — and 29% higher than in May 2021.
The dry van truckload contract rate index VCRPM1 showed upward pressure building on truckload rates in November, most likely in the form of route guide failures and tender waterfalling rather than permanent rate increases. The fact that this index continues moving higher reflects that truckload rates are increasing more sustainably.
The LTL market tends to follow the truckload environment by roughly three to six months and is almost entirely based on contracts or blanket pricing agreements lasting at least a year. The notable exception occurred in 2023, when the third-largest national LTL carrier, Yellow, exited the market.
LTL differs from the truckload market in several ways, but one of the most significant is that LTL carriers do not turn down loads due to lack of availability — instead, general service levels deteriorate as linehaul networks (the truckload moves between hubs) come under strain.
This close connection to the truckload market is what causes LTL rates to eventually follow truckload pricing trends, but at a much slower pace. This recent response is running roughly on schedule, but is stronger than expected.
The nuance here is that the truckload market turn began during the holiday peak season, which typically does not affect the LTL market, as LTL is less tied to retail shipping and replenishment.
December and January are typically the slowest months of the year for LTL, as manufacturing plants close and shipping and receiving dock hours are reduced. Winter weather also has a strong influence, as networks stall — though unlike in the truckload market, weather does not necessarily lead to rate increases.
There is no meaningful spot market for LTL, so urgency is never reflected in real time; shippers have no centralized venue to bid for capacity against one another. In many cases, shippers use the LTL market as a relief valve for truckload tightness by breaking up full truckloads and moving them through the LTL market for guaranteed capacity — though at lower service levels and higher prices. The average weight per shipment has increased approximately 11% since the start of the year, suggesting this is probably occurring.
This makes the current LTL pricing surge all the more notable, as it takes a significant market shift to produce sharp changes in this space. Some of this sharpness may be a correction for softness in the first two months of the year: rates showed a 1.7% year-over-year decline in January and a 1.2% decline in February. The March print more than corrected for those declines, posting a 7% year-over-year jump.
The LTL market is typically less volatile than the truckload market, as there are far fewer providers and, as noted, rates are almost entirely negotiated over long periods. This also means that increases are stickier and take longer to unwind.
About the Chart of the Week
The FreightWaves Chart of the Week is a chart selection from SONAR that provides an interesting data point to describe the state of the freight markets. A chart is chosen from thousands of potential charts on SONAR to help participants visualize the freight market in real time. Each week a Market Expert will post a chart, along with commentary, live on the front page. After that, the Chart of the Week will be archived on FreightWaves.com for future reference.
SONAR aggregates data from hundreds of sources, presenting the data in charts and maps and providing commentary on what freight market experts want to know about the industry in real time.
Brokerage Compliance Symposium
The day before F3. Every compliance issue you face - fraud exposure, carrier liability, FMCSA rules, cargo theft, insurance gaps - navigated by attorneys and operators defining best practices in a changing industry.
F3 Awards Dinner
The night before F3. FreightTech100 companies honored. FreightTech 25 and Shipper of Choice winners revealed live. Cocktail reception into dinner and live music - 300 industry leaders in one purpose-built room.
F3: Future of Freight Festival
Industry-defining keynotes, rapid-fire technology demos, and industry leaders networking in experiences across Chattanooga - plus the inaugural F3 Awards Dinner featuring the FreightTech and Shipper of Choice reveals.
The day before F3. Every compliance issue you face - fraud exposure, carrier liability, FMCSA rules, cargo theft, insurance gaps - navigated by attorneys and operators defining best practices in a changing industry.
The Signal at Chattanooga Choo Choo • Chattanooga, TN Register NowThe night before F3. FreightTech100 companies honored. FreightTech 25 and Shipper of Choice winners revealed live. Cocktail reception into dinner and live music - 300 industry leaders in one purpose-built room.
The Signal at Chattanooga Choo Choo • Chattanooga, TN Register NowIndustry-defining keynotes, rapid-fire technology demos, and industry leaders networking in experiences across Chattanooga - plus the inaugural F3 Awards Dinner featuring the FreightTech and Shipper of Choice reveals.
The Signal at Chattanooga Choo Choo • Chattanooga, TN Register Now