How much trucking capacity is on the road right now depends almost entirely on which carriers you are counting, because the national fleet is really several different markets stacked together, the owner-operators running a truck or two, the mid-sized fleets, and the largest carriers, and each of those groups is in a different place heading into year-end, which is why a single top-line number tends to hide more than it shows. Break the tractor counts out by fleet size and the gaps between those segments become the real capacity story.
The Top-Line Signals Are Mixed
Before going tier by tier, it helps to set the backdrop, and the backdrop is not sending one clean signal. The SONAR Truckload Rejection Index, which tracks how often carriers turn down the freight shippers tender to them, sits at 12.95 percent. That is above its trailing 12-month average of 8.18 percent, so capacity is tighter than it was a year ago, but it has also eased down from the mid-teens readings it hit over the summer, so the tightening has lost some momentum rather than accelerating.
Volume tells a similarly flat story. The SONAR Truckload Volume Index, a measure of accepted electronic tender volume, sits at 11,636.92, essentially flat on the day and only marginally above its 12-month average of 11,489.59. Freight is moving at a steady clip, neither falling off nor breaking out. Put those two together and the national picture is a standoff, demand holding, capacity a little tighter than last year but no longer tightening hard. That is exactly why the more useful read right now is underneath the top line, in how capacity is distributed by fleet size.
The Owner-Operator Segment Has Round-Tripped Its Boom
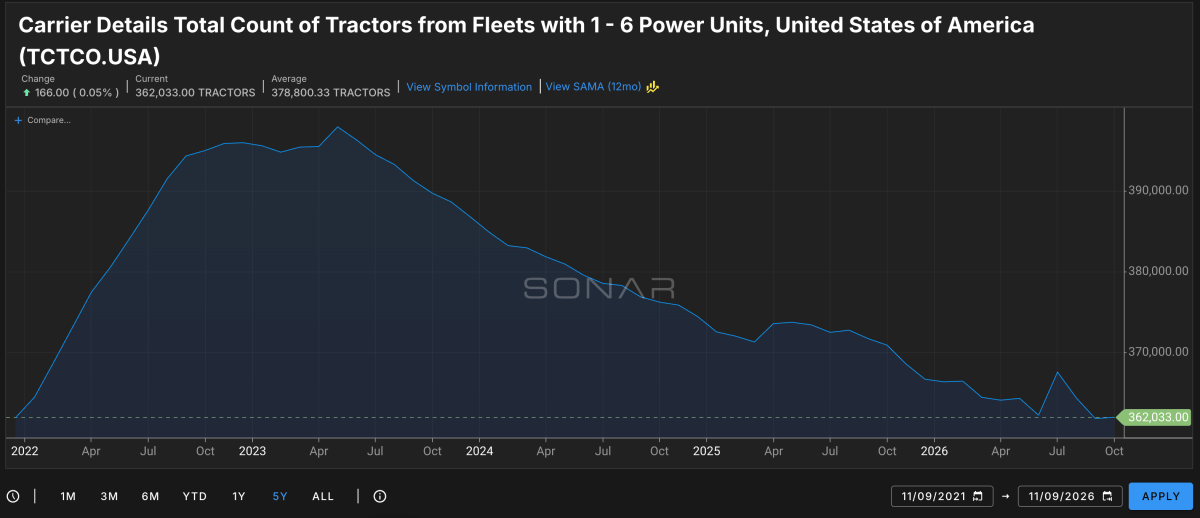
Start with the smallest carriers, because they have moved the most. SONAR’s count of tractors run by fleets with one to six power units stands at 362,033, and the five-year view is the one that matters. This segment sat near 362,000 tractors in early 2022, surged to a peak close to 398,000 in the first half of 2023 as pandemic-era freight and easy authority pulled a wave of new entrants into the market, and has declined almost without interruption ever since. It is now back to roughly where it started, below its five-year average of about 378,800 and below its 12-month average of about 364,960.
That is close to 36,000 tractors, on the order of nine percent of the segment, pulled back out of the most fragile tier of the market over three and a half years. These are the operators most exposed to the spot market, with the least cost advantage on fuel, insurance, and maintenance, and the thinnest cushion to ride out weak rates, so when conditions soften they are the first to park a truck or let an authority lapse. The entire pandemic-era surge in small-carrier capacity has effectively been unwound, which is a very different starting point than the market had a couple of years ago, whichever way demand breaks from here.
The Mid-Market Is Setting Records
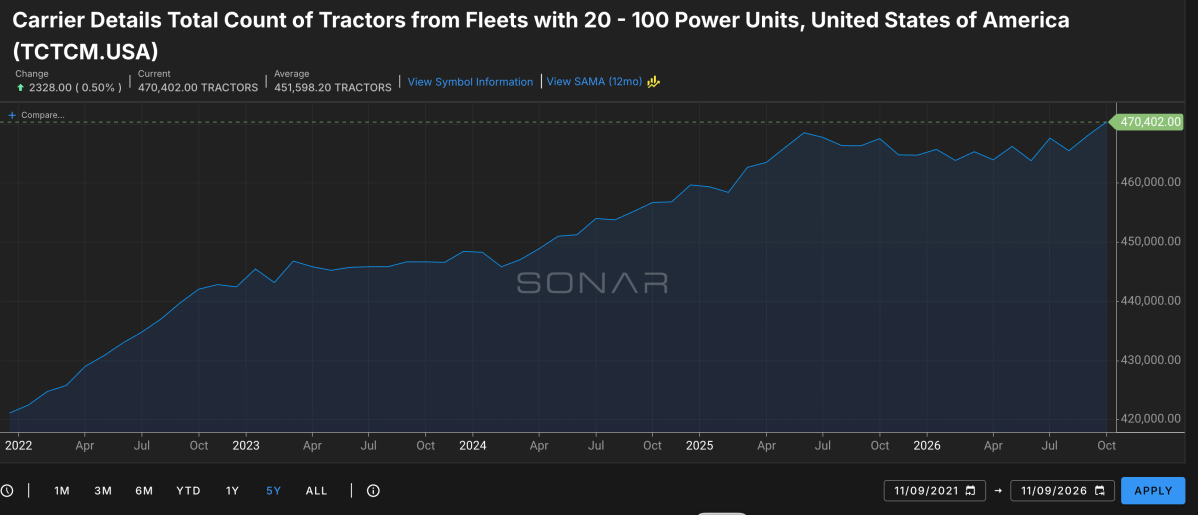
The mid-sized fleet is the counterweight. SONAR’s count of tractors run by carriers with 20 to 100 power units sits at 470,402, a fresh high, up about a half percent in its latest monthly reading and comfortably above its trailing 12-month average of roughly 451,600. Over five years this band has climbed steadily from about 420,000 tractors to this new record, and unlike the other two tiers it has barely paused.
This is the segment built to absorb. These carriers are big enough to hold real contract freight, run drop-and-hook programs, and operate the lease-on fleets that owner-operators sign onto when running their own authority stops penciling out. When a driver gives up a one-truck operation and leases onto a larger carrier, that tractor does not leave the road, it moves from being counted in the one-to-six tier into a mid-sized fleet. Part of what the record in this band likely reflects is that migration, capacity shifting from the bottom of the market into its middle rather than exiting the industry altogether. One caveat belongs here, because these counts are built from carriers’ MCS-150 filings, so some of the apparent movement into the 20-to-100 band can be carriers updating their paperwork rather than trucks physically changing fleets, which is a reason to read the multi-year trend rather than lean on any single month.
The Biggest Fleets Are Running Lean
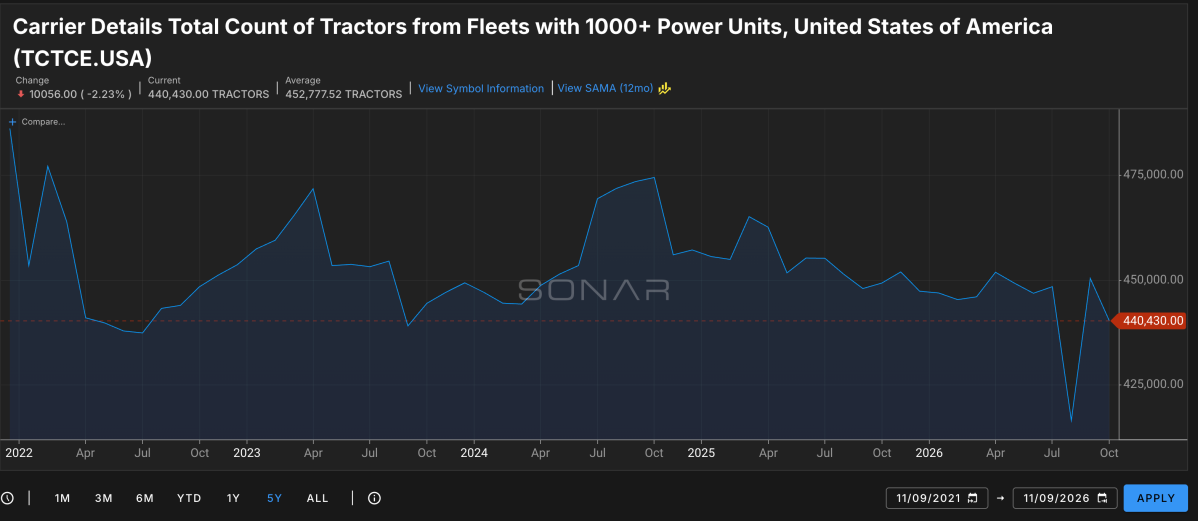
The largest carriers round out the picture, and they are not expanding. SONAR’s count of tractors run by fleets with 1,000 or more power units sits at 440,430, down a sharp 2.23 percent in its latest monthly reading, a drop of more than 10,000 tractors, leaving it below its trailing 12-month average of about 452,800. The five-year line for this group is the choppiest of the three, swinging from near 485,000 tractors in early 2022 down into the 430,000s, back toward 475,000 in late 2024, then grinding lower through 2025 and 2026 with a sharp dip toward 418,000 over the summer before a partial bounce.
The behavior here looks like discipline. The largest fleets can right-size faster than anyone, declining to renew leases, parking underutilized tractors, and trimming fleets that are not earning within a quarter, and the volatility in this line is the fingerprint of exactly that. For now they are holding their counts lean and below their own average, which means the tier most capable of adding a lot of capacity quickly is choosing not to.
Both Ends Are Thin, The Middle Is Full
Line the three tiers up and a clear shape appears. The smallest one-to-six band has round-tripped its boom and sits below its averages. The largest 1,000-plus band is running lean and below its average. Only the mid-sized 20-to-100 band is at a record. Capacity is concentrating in the middle of the market, pulled up from the bottom by owner-operators who lease on or fold, and kept in check at the top by giants who are not re-expanding.
What that might signal is worth thinking through carefully rather than forcing into a forecast. On one hand, the capacity base at the bottom is structurally thinner than it has been in years, and thin, exited small-carrier capacity does not come back on a dime, so if freight demand firms, the market could tighten faster than the flat rejection reading suggests today. On the other hand, with rejections already easing off their summer highs and volumes holding flat, there is no demand pull right now forcing that to happen. The honest read is a loaded-but-quiet setup, a capacity base that has quietly thinned at both ends while the top-line waits for a catalyst. That is a lens on the months ahead, not a prediction of them.
The Churn Beneath The Net Numbers
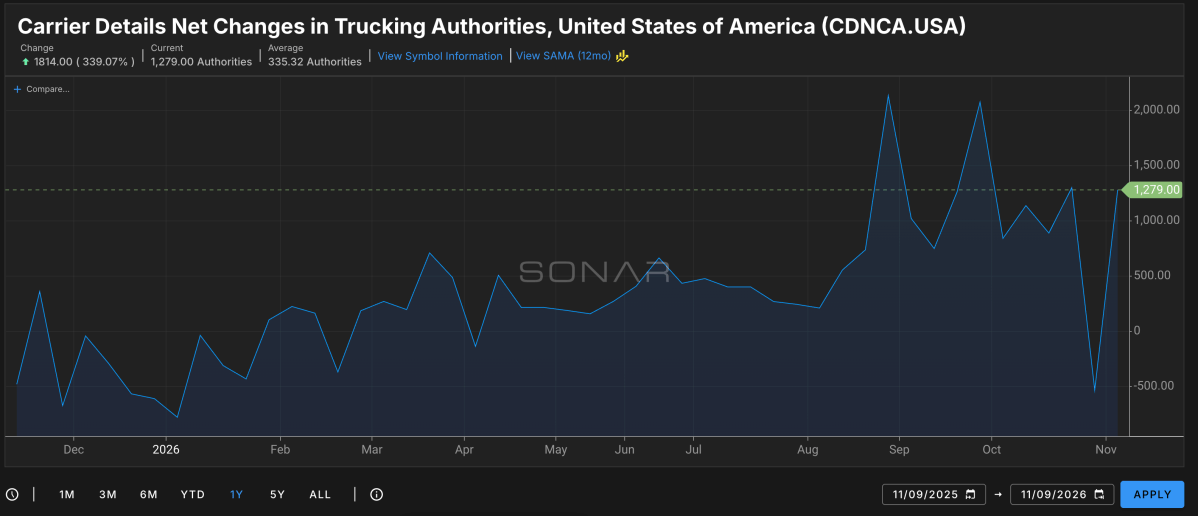
The net figures sit on top of constant churn in the federal authority rolls. In a single day’s file of FMCSA Motus carrier changes dated November 9, there were 367 operating-authority updates across 362 individual carriers, of which 199 were in active status, 103 were inactive, 57 were pending, and 8 were formally withdrawn, and more than 90 percent were motor carriers of property carrying the familiar 750,000 dollar insurance requirement. That file comes with a real caveat right now, because the Motus system rollout has paused certain USDOT deactivations tied to biannual update requirements while pushing a backlog of reinstatements through at the same time, which distorts the active and inactive tallies and makes any single day a poor read on true entry and exit. It is a reminder that the authority rolls are in constant motion rather than a clean count of who is coming and going, and because the file carries no fleet-size information, it cannot on its own say which size of carrier is lapsing. The fleet-size picture has to come from the SONAR tractor counts above, not from the authority file.
The Takeaway For The Small Carrier
For the owner-operator reading their own segment in that long decline, the point is not that the small carrier is finished, it is to understand what the last three and a half years selected for. The operators still standing are the ones who know their true cost per mile, who built direct relationships with local shippers instead of living and dying by spot postings, and who ran the business like a business rather than a truck payment. In a market that is tighter than last year but not yet pulling hard in anyone’s favor, that structure is what separates the carriers positioned to benefit if the market firms from the ones who keep showing up in the inactive column no matter what rates do.
Why It Matters
Capacity is not a single number that is cleanly rising or falling right now, it is splitting by fleet size, with the smallest operators having unwound their entire pandemic boom, the largest carriers running deliberately lean, and the mid-sized fleets at a record as they absorb what the bottom lets go. For carriers, brokers, and shippers, the value in that split is as a current lens rather than a forecast, because it shows a capacity base that has quietly thinned at both ends while demand holds flat, and that is the kind of setup that decides how fast the market can move whenever the next real catalyst, up or down, finally arrives.
This analysis draws on FreightWaves SONAR data as of early November 2026: tractor counts by fleet size for the 1-to-6 power-unit segment (TCTCO.USA) at 362,033, the 20-to-100 segment (TCTCM.USA) at 470,402, and the 1,000-plus segment (TCTCE.USA) at 440,430, the SONAR Truckload Rejection Index (STRI.USA) at 12.95 percent, and the SONAR Truckload Volume Index (STVI.USA) at 11,636.92.