Using data provided to American Shipper by the trade intelligence firm Zepol Corp., we’ll take a closer look at each of these companies in terms of where their cargo originates, where in the United States it’s destined, which liner carriers they use, and how their volumes have trended quarter to quarter.
The series will count down monthly until we analyze the top U.S. inbound NVO in December. Data is derived from Zepol’s database, which uses U.S. Customs data direct from carrier bills of lading as they are entered in the Automated Manifest System.
The top 12 U.S. inbound NVOs for this series were determined based on their total volume in 2011, though the statistics provided by Zepol will be updated monthly so that each NVO will be examined based on the most recent 12-month period – in this case, the period between Nov. 1, 2011 through Oct. 30, 2012.
This month, we’ll examine Blue Anchor Line, the NVO subsidiary of global third party logistics company Kuehne + Nagel (K+N).
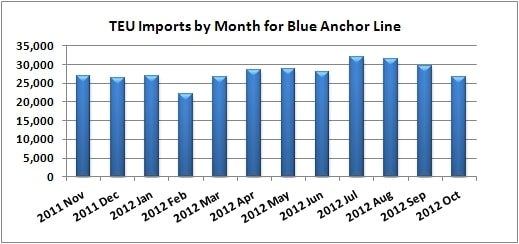
Blue Anchor has handled 333,647 TEUs of U.S. inbound volume over the last 12 months. That’s roughly 5 percent higher than its 2011 calendar year volume.
| Source: Zepol |
Blue Anchor moved 18.2 percent of its volume through New York/New Jersey, 15.8 percent through Los Angeles, 11.1 percent through Charleston, 10.9 percent through Long Beach, and 8.3 percent through Norfolk. Blue Anchor has among the most diversified port usage of any inbound NVO, with eight destination ports accounting individually for 5.8 percent or more of its volume.
As for origin nations of U.S. inbound cargo, China accounts for less a third of Blue Anchor’s volume, a huge departure from most of the NVOs in this countdown, even relative to other European-centric NVOs. For instance, more than 40 percent of Danmar’s volume originated in China, while 36 percent of SCHENKERocean’s volume came from China. It’s fair to say that Blue Anchor is less dependent on China cargo than any other U.S. inbound NVO.

|
| Source: Zepol |
As for which container lines Blue Anchor uses most frequently, Hapag-Lloyd and Maersk Line are far and away the leaders. Hapag-Lloyd handled 17.2 percent of Blue Anchor’s inbound cargo in the last 12 months, while Maersk handled 14.8 percent. After that, the next eight most used carriers handled between 3.8 percent and 8.2 percent. Rounding out the top five were Evergreen Line, Mediterranean Shipping Co. and China Shipping.

|
 |
| (Click to see full-sized charts.) |
Brokerage Compliance Symposium
The day before F3. Every compliance issue you face - fraud exposure, carrier liability, FMCSA rules, cargo theft, insurance gaps - navigated by attorneys and operators defining best practices in a changing industry.
F3 Awards Dinner
The night before F3. FreightTech100 companies honored. FreightTech 25 and Shipper of Choice winners revealed live. Cocktail reception into dinner and live music - 300 industry leaders in one purpose-built room.
F3: Future of Freight Festival
Industry-defining keynotes, rapid-fire technology demos, and industry leaders networking in experiences across Chattanooga - plus the inaugural F3 Awards Dinner featuring the FreightTech and Shipper of Choice reveals.
The day before F3. Every compliance issue you face - fraud exposure, carrier liability, FMCSA rules, cargo theft, insurance gaps - navigated by attorneys and operators defining best practices in a changing industry.
The Signal at Chattanooga Choo Choo • Chattanooga, TN Register NowThe night before F3. FreightTech100 companies honored. FreightTech 25 and Shipper of Choice winners revealed live. Cocktail reception into dinner and live music - 300 industry leaders in one purpose-built room.
The Signal at Chattanooga Choo Choo • Chattanooga, TN Register NowIndustry-defining keynotes, rapid-fire technology demos, and industry leaders networking in experiences across Chattanooga - plus the inaugural F3 Awards Dinner featuring the FreightTech and Shipper of Choice reveals.
The Signal at Chattanooga Choo Choo • Chattanooga, TN Register Now