


This week’s DHL Supply Chain Pricing Power Index: 70 (Carriers)
Last week’s DHL Supply Chain Pricing Power Index: 70 (Carriers)
Three-month DHL Supply Chain Pricing Power Index Outlook: 65 (Carriers)
The DHL Supply Chain Pricing Power Index uses the analytics and data in FreightWaves SONAR to analyze the market and estimate the negotiating power for rates between shippers and carriers.
The Pricing Power Index is based on the following indicators:
Volume levels break the downward slide on Monday
The Outbound Tender Volume Index (OTVI) has continued for most of the week, though tender levels did tick higher on Monday. OTVI has fallen by 2.04% week-over-week (w/w), but Monday’s increase was over 0.5%. The uptick should continue through the rest of the week as capacity tightens and more tenders need to be sent out.
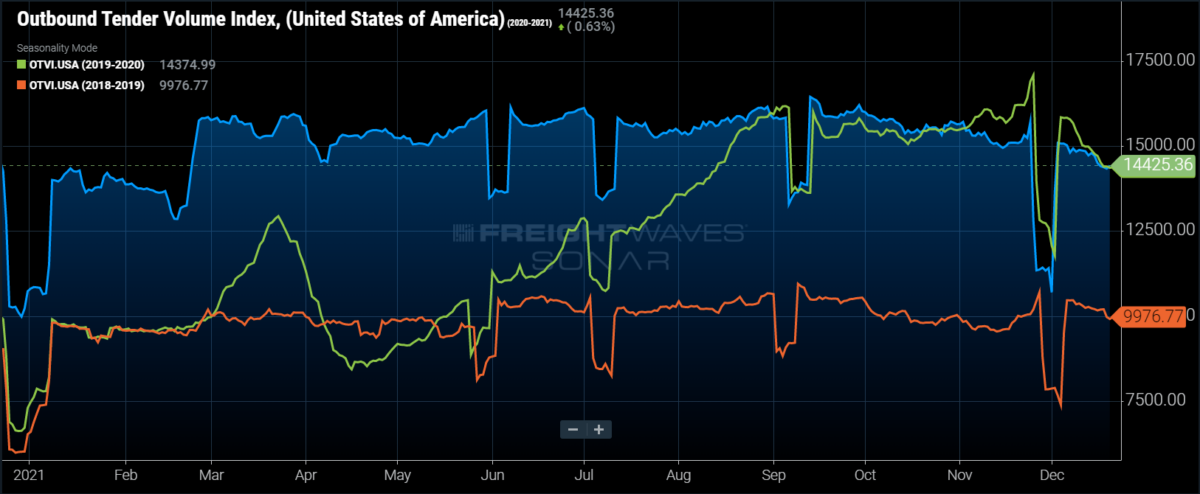
SONAR: OTVI.USA: 2021 (blue), 2020 (green) and 2019 (orange)
To learn more about FreightWaves SONAR, click here.
With the uptick on Monday, tender volumes have inflected positively for the first time since early November. After outperforming for most of the year, tough comps and a strong 2020 peak season caused tender volumes to have the strongest November on record. In 2021, tender volumes have been elevated at peak-like levels for nearly the entire year, so peak season, while the peak was less pronounced than in 2020, tender levels remain at remarkably high levels.
Tender volumes are elevated, but what about true volume levels? Adjusting OTVI, which includes both accepted and rejected tenders, by the Outbound Tender Reject Index (OTRI) gives a closer indication as to true volume levels flowing through the networks. Over the past week, accepted volumes have fallen by 4.35%, in large part to tender volumes falling and capacity coming offline for the holiday. Even with the significant drawdown, accepted tender volumes are more than 9% higher than 2020, signaling that there is still a tremendous amount of freight moving throughout the country.

SONAR: OTVIW (color) and Outbound Tender Market Share (height).
To learn more about FreightWaves SONAR, click here.
With the weekly decline on the national level, it’s no surprise that the majority of the country experienced tender volumes decline over the past week. Of the 135 freight markets within FreightWaves SONAR, 60 reported w/w increases.
Three of the large warehousing markets experienced increased volume levels over the past week. The largest market in the country, Ontario, California, experienced volumes increase by 0.6% w/w, while the neighboring market, Los Angeles, witnessed volume levels fall by over 9%. In Harrisburg, Pennsylvania, the third-largest market in the country, tender volumes rose by 3.1% w/w.
In Texas, both Dallas and Fort Worth experienced a strong week for tender volumes, rising by 3% and 6.9% w/w, respectively.
By mode: It was another strong week for reefer volumes as the Reefer Outbound Tender Volume Index (ROTVI) increased by 2.29% w/w. Reefer volumes are still well below year-ago levels, currently down 3.75% y/y. Reefer volumes should benefit from the colder weather as some shippers have to transition to protect goods from freezing.
Dry van volumes had another soft week as the Van Outbound Tender Volume Index (VOTVI) fell by 2.88% w/w. Like the reefer market, van tender volumes are continuing to underperform year-ago levels. With much of consumer spending pulled forward, the peak season hasn’t been as peaky as expected, but volumes should remain elevated as shippers continue to try and replenish inventories.
Rejection rates back above 21% for first time since October
Rejection rates continue to climb ahead of the back-to-back holiday-affected weeks. OTRI, which is a measure of relative capacity in the market, jumped to 21.07%, the first time rejection rates have been above 21% since Oct. 10. The upward trajectory of rejection rates will likely continue over the next week until drivers return to the road following the holidays.

SONAR: OTRI.USA: 2021 (blue), 2020 (green) and 2019 (orange).
To learn more about FreightWaves SONAR, click here.
Over the past week, the national rejection rate has increased by 190 basis points (bps), the largest weekly increase since February, when the extreme winter weather affected most of the country. Rejection rates haven’t moved up as fast as they have in the previous year, but with the contract rate increases over the past year, that’s not necessarily a surprise.
Even as rejection rates have increased over the past week, OTRI is still 669 bps below 2020 levels. The likelihood of reaching the highs of 2020 is unlikely due to the rise of contract rates, but they should remain elevated compared to 2019 and early 2020 levels for the foreseeable future, even as capacity returns to the market.
The trouble is that capacity entering the market hasn’t been able to keep up with freight demand, thus higher rates haven’t driven rejection rates back down to more “normal” levels. Add in various other constraints in the transportation market and it leads to extremely tight capacity persisting for the better part of 18 months.

SONAR: UT3.USA (blue), UT4.USA (green) and UT5.USA (orange)
To learn more about FreightWaves SONAR, click here.
Why has there not been a surge in capacity flooding the market?
The barriers to entry are arguably higher than they have been, especially for smaller carriers to add to their fleets through the used equipment market. Used truck prices have surged over the past year as OEMs have struggled to produce new equipment amid record new truck orders. Why is this important? Large carriers are holding onto equipment longer, thus starving the used equipment market of supply while also being hit on the elevated demand side. This causes an upward spiral in used equipment prices.

SONAR: WRI (color)
To learn more about FreightWaves SONAR, click here.
As expected when the overall rejection rate moves higher, the majority of the freight markets experience an uptick as well. Of the 135 markets, 115 experienced rejection rates move higher this week.
The map above shows the Weighted Rejection Index (WRI), the product of the Outbound Tender Reject Index — Weekly Change and Outbound Tender Market Share, as a way to prioritize rejection rate changes. With a capacity tightening around the country, there are a lot of blue markets, which are the markets to focus attention.
The Denver market is one of the most volatile markets in the country at the moment. Rejection rates in Denver have increased by 605 bps over the past week. Since the market is relatively large, any loads out of the market should take priority when trying to secure capacity.
Dallas is another market to prioritize as rejection rates have increased by 342 bps over the past week.
These markets represent those where carriers have clawed back any pricing power. Expect increased spot market activity in the blue markets that will ultimately place upward pressure on rates.

To learn more about FreightWaves SONAR,click here.
By mode: All modes have experienced relative capacity tighten over the past week. The flatbed market has tightened faster than the other two modes, likely due to the size of the flatbed market in comparison. The Flatbed Outbound Tender Reject Index (FOTRI) increased by 594 bps w/w, reaching 32.89%, a new all-time high in the dataset.
The reefer market ratcheted tighter as well as the Reefer Outbound Tender Reject Index (ROTRI) increased by 324 bps w/w. Reefer rejections are approaching 40% again but will likely not reach the highs set earlier in the year.
The van market was the laggard this week, but relative capacity did tighten in the marketplace. The Van Outbound Tender Reject Index (VOTRI) increased by 172 bps w/w, to 20.07%, the highest level since Oct. 24. Expect capacity to further tighten throughout the week.
Spot rates continue to slide ahead of the Christmas holiday
The spot rate data available in SONAR from Truckstop.com is updated every Tuesday with the previous week’s data.

SONAR: Truckstop.com’s national spot rate (blue, right axis) and dry van contract rate (green, left axis).
To learn more about FreightWaves SONAR,click here.
The Truckstop.com national spot rate, based on the top 100 lanes on Truckstop.com’s load board, continued last week’s downward slide. The national spot rate fell by 3 cents per mile to $3.44, including fuel surcharge and other accessorials, erasing all of the previous week’s increase. Even with the recent pullbacks, Truckstop.com’s national spot rate has maintained a near 20% gap with 2020 levels.
Of the 102 lanes from Truckstop.com’s load board, 68 reported decreases last week. The Los Angeles to Portland, Oregon, lane had the largest increase over the past week, increasing by 44 cents per mile to $4.63. The Los Angeles to Denver lane took a slight step lower, down 1 cent per mile to $4.66. Expect upward pressure on the rate in next week’s data as capacity in Denver has tightened rapidly.
Contract rates took a slight step up, rising 2 cents per mile to $2.75. Since contract rates are reported on a two-week lag, the Thanksgiving holiday impacts caused contract rates to match the all-time high of $2.77/mi. Expect that contract rates will experience another uptick ahead of the first quarter of the year.
Contract rates, which are the base linehaul rate excluding fuel surcharges and other accessorials that are included in spot rates, are maintaining a similar gap as spot rates, running up 18% y/y.
FreightWaves’ Trusted Rate Assessment Consortium (TRAC) spot rate from Los Angeles to Dallas fell over the past week. The FreightWaves TRAC rate in this dense lane fell by 1 cent per mile to $4.01. Expect some upward pressure throughout next week as volume imbalances will likely tighten capacity in Southern California in the coming days.

To learn more about FreightWaves TRAC, click here.
FreightWaves’ TRAC spot rate from Atlanta to Philadelphia gave back all of last week’s increase. The FreightWaves TRAC rate decreased by 3 cents per mile to $3.65 over the past week.

To learn more about FreightWaves TRAC, click here.
Ultimately, some of the inflationary pressures on rates have alleviated themselves as capacity has returned to the market. Pressure remains on contract rates to move higher in 2022, due to the elevated rejection rates, but the move higher may not be as pronounced as it was in 2021. Either way, carriers still hold most of the pricing power in the market, though shippers are slowly clawing it back in their favor.
For more information on the FreightWaves Freight Intel Group, please contact Kevin Hill at [email protected] or Tony Mulvey at [email protected].
Check out the newest episodes of our podcast, Great Quarter, Guys, here.