


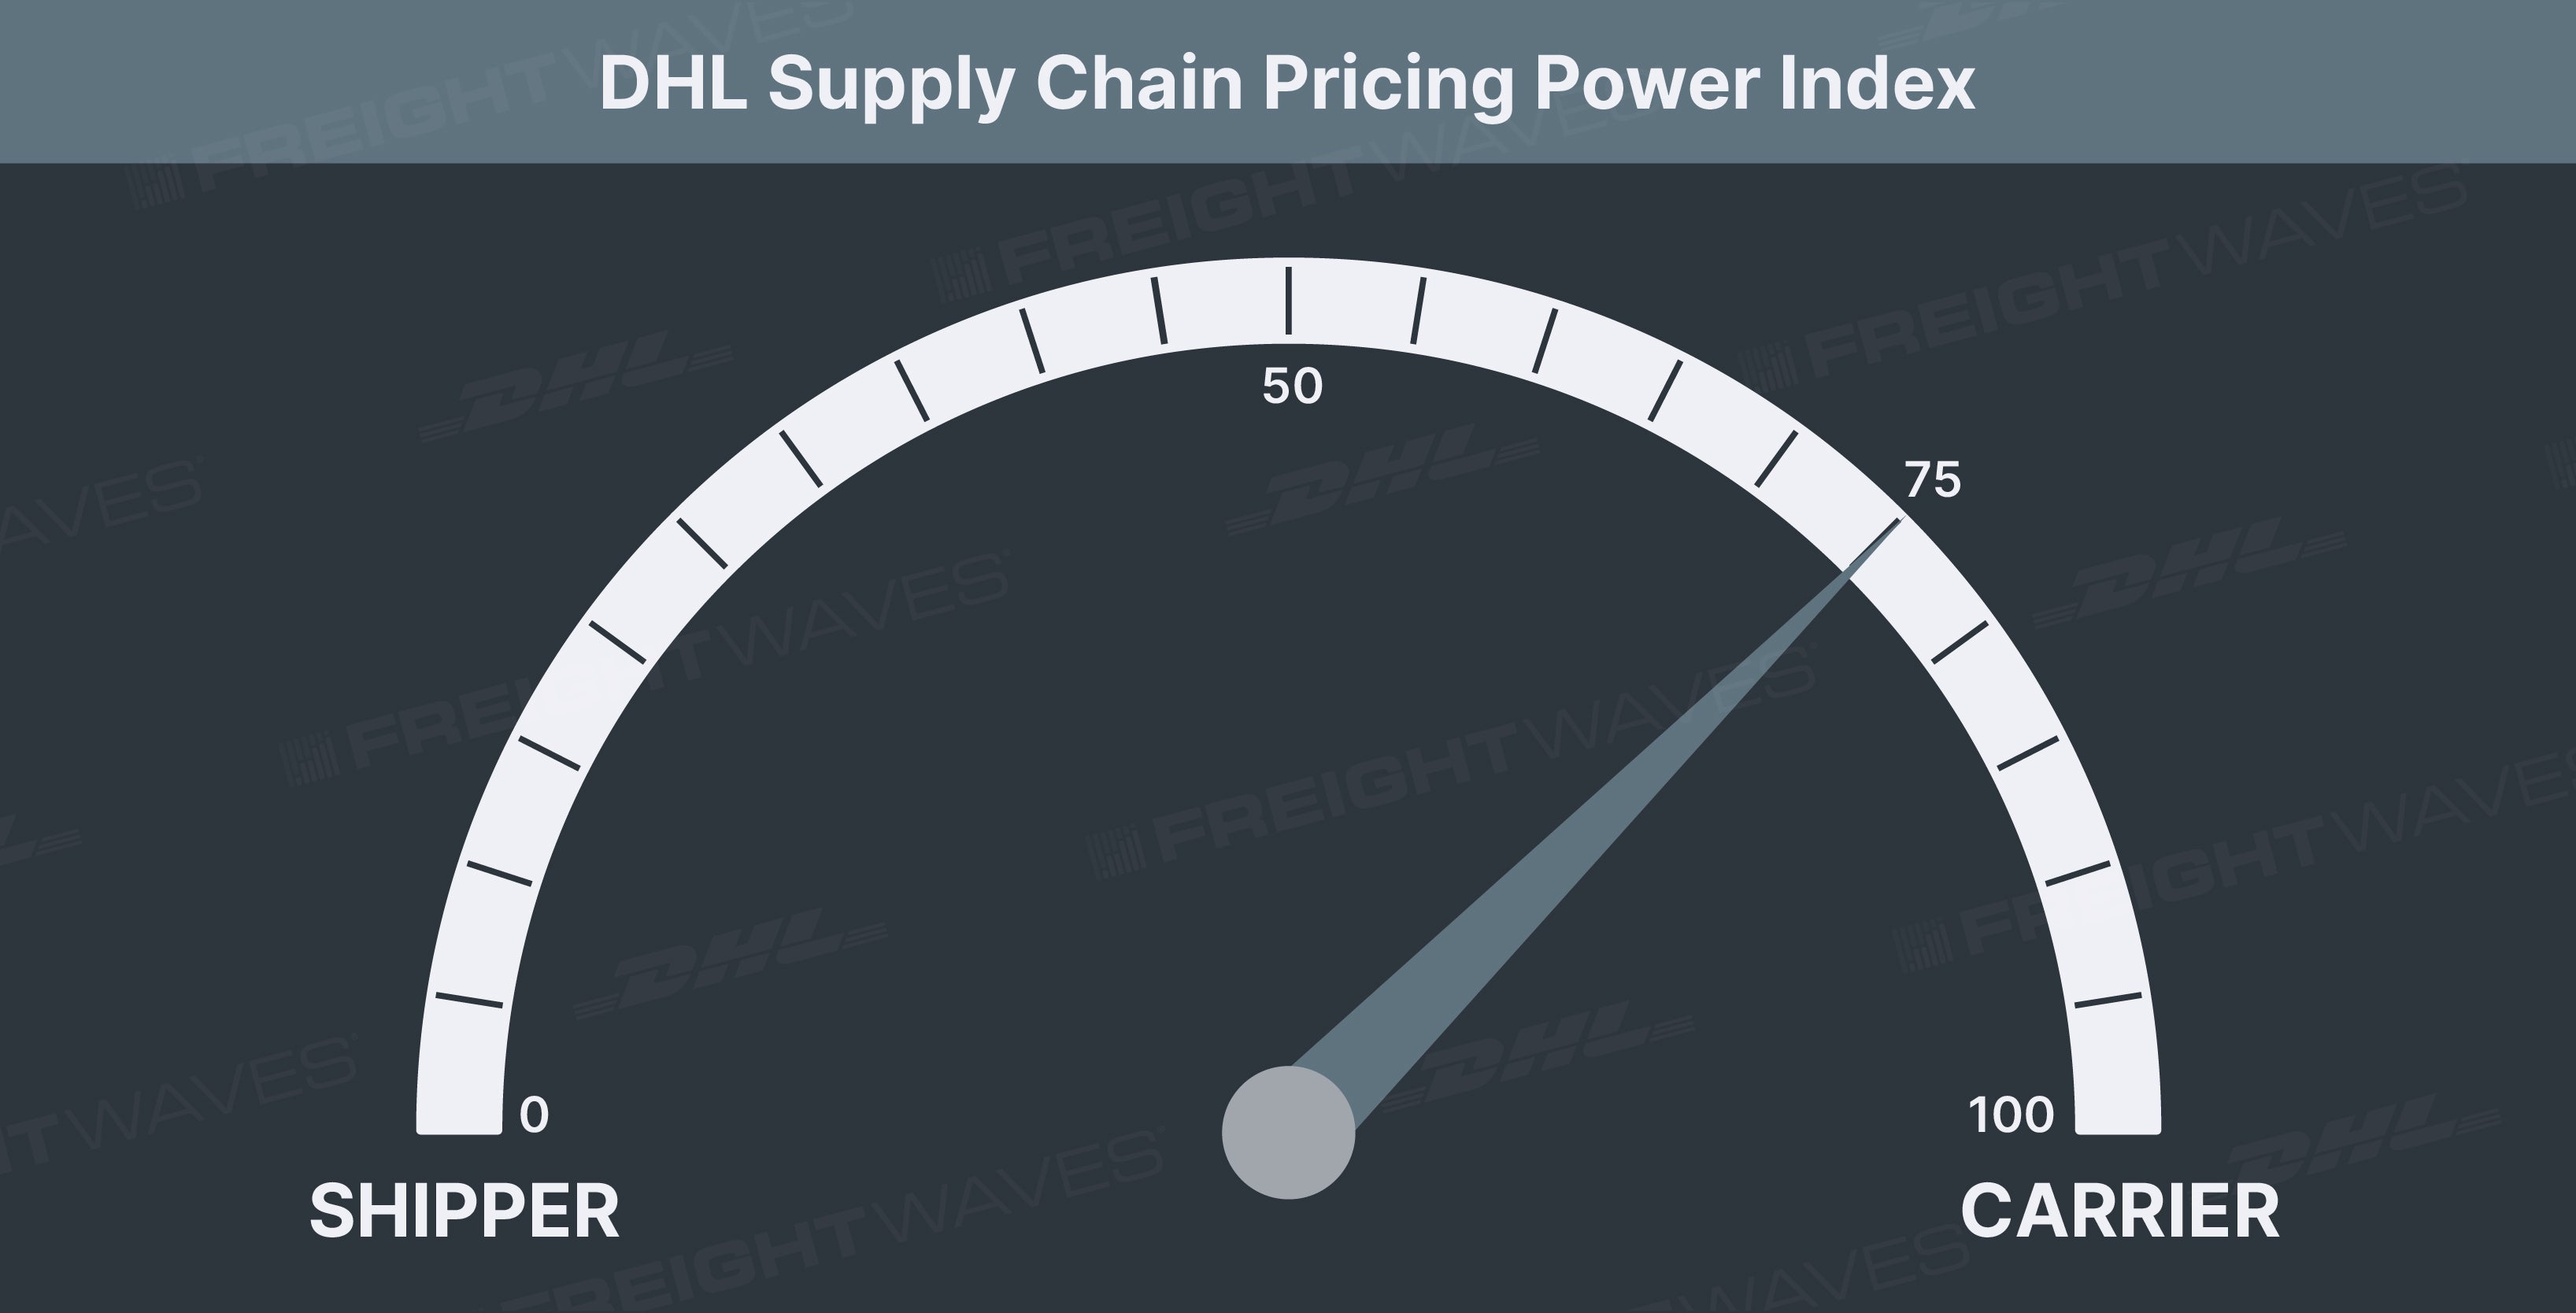
This week’s DHL Supply Chain Pricing Power Index: 75 (Carriers)
Last week’s DHL Supply Chain Pricing Power Index: 75 (Carriers)
Three-month DHL Supply Chain Pricing Power Index Outlook: 75 (Carriers)
The DHL Supply Chain Pricing Power Index uses the analytics and data in FreightWaves SONAR to analyze the market and estimate the negotiating power for rates between shippers and carriers.
The Pricing Power Index is based on the following indicators:
Load volumes continue upward momentum to close out Q3
The Outbound Tender Volume Index (OTVI), shippers’ requests for capacity, continues the positive momentum established last week. Over the past week, OTVI has increased by just 0.55% but eclipsed the 16,000 mark again and is likely not to slow down the positive momentum through the traditional peak season.

SONAR: OTVI.USA: 2021 (blue), 2020 (purple) and 2019 (green)
To learn more about FreightWaves SONAR, click here.
September was another strong month for tender volumes as absolute volumes increased by nearly 1.5% during a month that was affected by Hurricane Ida and Labor Day. Absolute tender levels are maintaining the strength held over 2020 levels, though comps have become increasingly difficult. OTVI on a year-over-year basis is still running up over 3%, which is roughly in line with where the index has hovered for the better part of the month.
OTVI, which includes accepted tenders and rejected tenders, signals that shippers are sending out more tenders to carriers than ever before. Adjusting OTVI by the tender rejection rate aids in painting a picture of accepted freight volumes moving through networks. The accepted tender levels are just all off the all-time high established at the beginning of September but are still nearly 8% above year-ago levels.
Over the past week, accepted tender levels have increased by nearly 1%, outpacing absolute tender levels thanks to pulling back ever so slightly.
As port congestion continues to hamper transportation networks, the pullback in intermodal volumes is putting increased pressure on truckload networks. This pressure is likely to lead to higher tender volumes during the final quarter of the year as shippers race to get goods in position for the holiday season that is quickly approaching.

SONAR: OTVIW (color) and OTMS (height)
To learn more about FreightWaves SONAR, click here.
Across the country, 72 of the 135 markets tracked by FreightWaves SONAR were lower over the past week. The largest markets in the country started to see an increase in freight volumes over the past week, while rejections pulled back, signaling that more volume is flowing through these markets.
Ontario, California, and Los Angeles, the largest and fifth-largest freight markets, respectively, saw freight volumes trend higher over the past week. In Ontario, tender volumes increased by 3.8% w/w. Compared to last year, freight volumes in the market are slightly down, just a quarter of a percent y/y, though that will likely turn positive in the upcoming weeks. In Los Angeles, freight volumes increased by over 8% w/w but are still off 2020 levels by nearly 13%.
The second-largest freight market in the country, Atlanta, has positioned itself well to have a strong fourth quarter as shippers’ requests for capacity in the market increased by 4.4% over the past week.
By mode: Reefer volumes are taking a slight breather to wrap up Q3. Over the past week, reefer volumes have fallen by 1.7%, giving back all of last week’s increase. Reefer volumes have once again turned negative y/y though comps at this time last year were extremely difficult. The difficult comps have reefer volumes down by 12% y/y, the widest the spread has been.
While reefer volumes take a breather, dry van volumes have continued to grow over the past week, jumping 1% w/w. Dry van volumes continue to outperform year-ago levels, holding on to a 0.5% y/y increase. Dry van demand is likely to increase over the coming months as markets like Ontario and Los Angeles experience booms in import levels, as well as other port markets like Elizabeth, New Jersey.
The chart below shows weekly customs import shipments into the Los Angeles market as well as Loaded Outbound International Container Volumes. Import volumes have been at elevated levels for the better part of a year, but the number of international intermodal containers leaving the Los Angeles market has fallen from 3,600 to 3,200. The railroads are faced with numerous challenges, including chassis availability and container imbalances, but the freight is still having to move out of the market. This is placing stress on transloading and warehousing facilities but also leading to high levels of pent-up demand for truckload capacity to be unleashed during peak season.

SONAR: ORAILINTL.LAX (blue) and WCSTM.LAX (green).
To learn more about FreightWaves SONAR, click here.
Tender rejections relatively stable as Q3 comes to a close
The Outbound Tender Reject Index (OTRI), a measure of relative capacity in the market, was climbing to begin the week but quickly reversed course to close out the week (and quarter). Over the past week, the national rejection rate fell by 23 basis points (bps) back below the 22% level.

SONAR: OTRI.USA: 2021 (blue), 2020 (orange) and 2019 (green).
To learn more about FreightWaves SONAR, click here.
OTRI has been bouncing back and forth between the 21.5% and 22.5% levels since Labor Day when rejection rates were above the 23% mark. Rejection rates were relatively stable in the third quarter, especially compared to the first two quarters when rejection rates were trending downward.
Even though rejection rates are still extremely elevated, especially compared to 2019 levels, rejection rates are over 400 bps lower than year-ago levels. This signals that contract rate increases (up roughly 25% y/y) have aided in driving carrier compliance but securing capacity is still extremely difficult.
That difficulty is likely to get worse before it gets better as adding assets is a challenge due to OEMs dealing with their own supply chain issues. Truck orders are still extremely strong, showing that carriers are investing in their fleets, but even when production is able to catch up, the labor market will still be extremely tight. Hiring qualified drivers is a concern for carriers that will likely persist into 2022.
Overall, the capacity constraints in the market are still quite difficult for shippers to secure necessary capacity even with elevated rates. Those constraints aren’t going to go away quickly, and any easing will have to be led by the demand side of the equation first.

SONAR: WRI.
To learn more about FreightWaves SONAR, click here.
Relative capacity did loosen across the majority of the country over the past week as rejection rates fell in 71 of the 135 freight markets. The map above shows the Weighted Rejection Index, which is the product of the Outbound Tender Reject Index-Weekly change and Outbound Tender Market Share. The WRI is used to show which markets are tightening or loosening the fastest relative to the size of the market.
The map highlights that markets like Lakeland, Florida, and Phoenix are loosening relatively fast. Rejection rates in the two markets were down 211 bps in Lakeland and 395 bps in Phoenix over the past week. Given the proximity to the largest freight markets in the country, the markets are seeing trucks enter, which is leading to less spot activity. These are two markets that carriers typically have trouble securing freight out of, and the conditions have only worsened over the past week.
On the other hand, Cape Girardeau, Missouri, as well as Dallas and Memphis are among markets where carriers are gaining pricing power. Over the past week, rejection rates have increased by nearly 200 bps in Dallas, nearly 1,500 bps in Cape Girardeau and 300 bps in Memphis.

To learn more about FreightWaves SONAR,click here.
By mode: Reefer is the only mode that has seen rejection rates increase over the past month. Reefer rejection rates increased by over 200 bps during September, coming just shy of the 40% mark again. The reefer market is by far the tightest of the modes within SONAR, more than 1,500 bps higher than the next closest, flatbed. Reefer contract rates really started to gain positive momentum in May, around the same time that reefer rejection rates began to fall, as new contracts drove better carrier compliance. Over the past couple of weeks, reefer contract rates have started to stabilize, pushing reefer rejections higher again. Reefer spot rates are still running up over 30%, making the spot market much more attractive for carriers. So, until reefer contract rates start to make up ground, like in the dry van market, reefer carrier compliance will continue to suffer.
The dry van market did loosen more than the overall market during the past week. Dry van rejection rates fell by 34 bps w/w. Dry van rejection rates are down 365 bps y/y as shippers have driven contract rates higher (up ~25% y/y) to improve carrier compliance. An interesting factor over the next six weeks will be the impacts the elevated import volume levels are going to have on the dry van market. With depressed intermodal volumes putting pressure on the truckload market, expect that carrier compliance will suffer as spot market activity increases as shippers need freight moved, no matter the costs.
The flatbed market is starting to loosen ever so slightly as the Flatbed Outbound Tender Reject Index dipped below 22% for the first time in more than a month. The infrastructure bill is likely going to keep demand for flatbed activity elevated, leading to flatbed rejection rates staying at elevated levels as carriers have selectivity in the market.
Freight rates remain elevated, facing more inflationary pressures
The spot rate data available in SONAR from Truckstop.com is updated at a 10-day lag.

SONAR: TSTOPVRPM.USA (blue, right axis); VCRPM1.USA (orange left axis)
To learn more about FreightWaves SONAR,click here.
Truckstop.com’s national spot rate, which includes fuel surcharge and other accessorials, fell by just 1 cent per mile over the past week to $3.48. The number of lanes that experienced more expensive spot rates was identical to the number that saw rates fall: 48.
Outbound of Los Angeles did become more expensive during the past week, with the exception of Los Angeles to Denver, which fell by 17 cents per mile to $4.41 — still more than 20% higher than year-ago levels. The pressure placed on this market is likely to bypass the contract market altogether, so there may not be an increase in volume levels as shown by OTVI, but spot activity in the market could pick up, sending rates out of Los Angeles even higher.
Dry van contract rates continue to climb higher, increasing another 3% over the past week. Contract rates, which are reported on a two-week lag, have increased by over 25% in the past year as an attempt to drive better carrier compliance. Even with the drastic increase in contract rates, it hasn’t proved to drive carrier compliance levels back to more normal levels and likely won’t. FreightWaves’ Todd Maiden wrote in a Sept. 15 article that 5% increases to rates would likely not be enough in 2022.
Ultimately, upward pressure on freight rates is likely to remain in place for at least the next six months and likely beyond as supply chain constraints continue to be worked through.
For more information on the FreightWaves Freight Intel Group, please contact Kevin Hill at [email protected] or Andrew Cox at [email protected].
Check out the newest episodes of our podcast, Great Quarter, Guys, here.