


The views expressed here are solely those of the author and do not necessarily represent the views of FreightWaves or its affiliates.
The six railroads that practice their marketing-term model that is called precision scheduled railroading (PSR) will be reporting their third-quarter financial results through the remaining days of October.
There is, however, an opportunity for a more holistic quarterly briefing.
This week’s market view rail column provides an argument for a new checklist of service metrics (Figure 4) that would be of interest mostly to customers and perhaps public policy groups.
However, instead of a balanced scorecard, we will likely see mostly an accounting report.
If the pattern holds true from past quarterly meetings and financial filings and PowerPoint slides, the railroads will focus almost exclusively on the following themes that matter internally to them.
- Internal operational efficiency of their train movements.
- Free cash flow after capex and other expenses.
- Rate of return on the company’s invested capital base.
The railroad volume discussion this month will demonstrate the steadily improving traffic volumes and revenue return since the early summer months. Improvements will include:
- Pricing leverage by commodity sector.
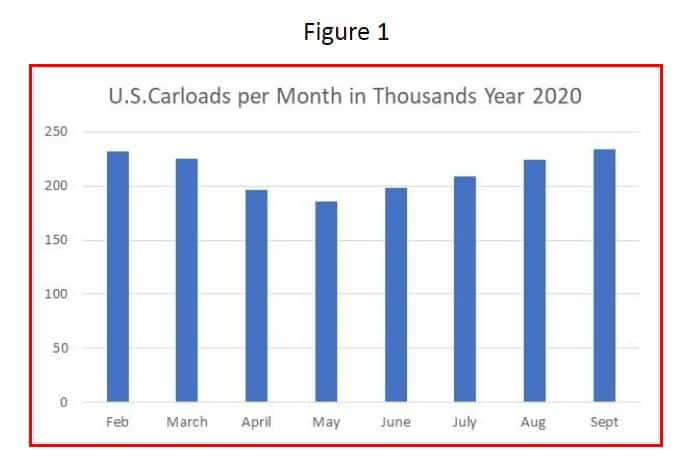
- Positive traffic recovery pace of volumes of customer freight being moved between the low second quarter and the end of the third quarter as shown in Figures 1 and 2.
- Significant improvement year-over-year during the third quarter of their intermodal rail volumes.
Yes, improvements are underway. Such as these for U.S. carload traffic.

These quarterly reports and the accompanying investor meeting presentations will showcase questions and answers between railroad top executives and investment analysts.
You can expect lively participation and some interesting questions as to the financial facts and hypotheses going forward. There is good traffic recovery news.
Here as of early October is the flash report of how relatively base line rail volume has recovered as of Week 41 on a four-week trending average from the drops in April-May:
- Total U.S. rail volumes year over year now almost even at -0.2%.
- Carload traffic lags a bit more, with merchandise rail down ~5.5%.
- Intermodal rail is up +6.7% same period year-over-year.
- Grain moves up ~30%.
Yet despite the encouraging financial and volume news, there is something missing. Being frank, there is not much of a customer focus at these “show and tells.” Rail freight customers and customer service are seldom featured. This is not a customer forum.
But it could be.
This old railroader argues that over time the railroads have gradually shifted from reporting past recent results to now slipping toward a prospective look-ahead messaging.
It may be a subtle shift, but older hands pick up on it.
Even a slight projection like statement of future outcomes from managers who control vast amounts of internal traffic and financial data changes the communication theme. It is no longer just an on-the-evidence report card.
Speculation wraps itself around the message.
Based upon research by this writer and a network of economically focused colleagues, these quarterly reports are in fact an early repository of what we call competitive intelligence.
It is naive for senior railroad managers or their board of directors to think that logistics managers are ignoring the market value of these somewhat closed briefings.
Therefore, why not use the meetings to make a pitch to those customers — particularly if your railroad has solid evidence of superior direct customer cash benefits?
If finally, you the PSR railroad have solid evidence of your better value for the customers’ pocketbook, then why not seize the moment?
Directly engage your customers.
Tease the marketplace in front of the investors with your products’ and services’ improving performance.
True, the third-quarter results are going to look relatively good in financial terms as the traffic base came back.
Why not make it look even better by showing your service delivery improvements?
Expand your report card.
Integrate investor and customer reporting by adding new performance improvement metrics.
PSR has indeed worked well at improving railroad operational delivery performance for carload freight, starting with CN, then Canadian Pacific, and more recently with service delivery scorecards published occasionally by CSX.
The main result is that railroad production has improved with fewer resources like crews and locomotives. That deserves a “bravo.”
There could, however, be some black marks. How? The 2020 cumulative year-to-date traffic is down regardless of the third-quarter recovery pace. Thus there is pressure on management to continue to increase earnings per share (EPS).
How do they achieve that? The railroads “might” selectively be swinging back to more “hold for tonnage” in order to keep decreasing the cost per ton or per carload under the motto of PSR net cash. If and where that might be true, it may possibly represent a “lazy PSR” shift, as my wise colleagues warn.
Translation: The railroaders might try to maximize quarterly higher productivity per train start across their track network. They try to keep train starts down, and hold trains selectively in yards for higher loads per departure.
Cars held to make departing trains longer “effectively delay final car delivery scorecards.”
The trade-off is that these so-called lazy PSR changes that lower unit costs might result in a reversal of the on-time final car delivery performance that has been promised to receivers (the end destination customer).
Where might that evidence be found?
Look for a pattern where previous quarters of system on-time carload delivery improved significantly, perhaps towards 85% or higher, but are now slipping back.
That lower scorecard mark suggests a trade-off that favors higher internal rail company margins (a lower OR) against a better service OT delivery.
The interpretation is that the network managers could be boosting their operating ratio efficiency report card against a service commitment.
Both investors and shippers simply need to evaluate that hypothesis.
If financial reporting is the No. 1 priority, it is going to be discovered by evaluating the financial reports. Because that is the data first revealed.
That is why the old hands closely examine these investor briefings.
That is why shippers should also watch, listen and evaluate.
Yes, this competitive observation approach has part of the mechanics of a spy novel. But none of the drama or danger.
What the market share-centered futurist wants to see in a quarterly briefing is a service delivery pattern that would capture the attention of Amazon-, Walmart- and Target-type distributors.
A signal they — along with others like Lowe’s and Home Depot — would interpret as a primary breakthrough in providing more accurate scheduled rail logistics.
Does not have to be as accurate as a Swiss watch
A report card that measures a clear PIVOT from internal “OR” management to external market share growth.
Colleagues, at some point we should expect that an announcement of such a pivot toward service and market growth might very well come during a Wall Street briefing.
Why before investors?
Because management will want to plead the rationale for changing its strategic business case methods before its investors.
That genuflecting toward Wall Street has symbolically become part of the North American Class 1 rail company culture.
I’d look for that signal at one of these meetings.
Maybe not yet.
But soon.
Has to be soon.
Because rail share continues to fall. Is it not?

When the time comes and railroad seniors address a dual audience that includes shippers and receivers, here in Figure 4 is what the new scorecard might look like as the 2020 to 2030 checklist ahead.
Even investors will eventually want evidence of volume and share growth. Because a cost control strategy eventually hits a wall.
What do you think?
What does your balanced scorecard look like if not this shown below?
Contrary opinions are welcome.

Footnotes:
BNSF as a Berkshire Hathaway company does not fit into the same investor meeting and reporting circle. They report and think differently.
As for the end of the third quarter, here are key October observations from the AAR.
Total carloads (excludes intermodal traffic) in September were down 9.7% from last year. That’s still a sizable decline, to be sure, but it’s the smallest monthly 2020 year-over-year same-period 2019 report card since back in March.
Excluding coal, which continues a multiyear pattern of traffic loss to natural gas utility energy supply, the overall all U.S. rail carloads were down just 2.9% in September 2020 from last year. A significant improvement versus these recent months:
-9.9% in August.
-12.7% in July.
-17.4% in June.
Source: Association of American Railroads’ Policy and Economics Department; Rail Time Indicators (RTI) monthly — contributors include Luisa Fernandez-Willey, Frank Hardesty, Dan Keen, Tiffany Placker and Rapik Saat. Overall senior management by John Gray.
The author recognizes significant periodic analytical rail sector contributions by other consultants, like Chris Rooney ([email protected]) and Karl Ziebarth ([email protected]). However, they might not entirely agree with this week’s above message.
Recognition goes to Bascome Majors and his analytical team at Susquehanna Financial Group for their database matching skills as evident in Figure 3. Note that they may interpret the data differently than in this market view column.
