


The oil market was abuzz this past week with a number that popped up in a closely watched weekly statistics report, with observers not realizing that a pair of one-off events in the trucking business may have caused it to look askew.
That number is the “product supplied” category in the weekly Energy Information Administration statistical report. The report itself is not arrived at by counting every barrel; there’s a degree of modeling in it as well. It’s often criticized for its imperfections, but the fuller monthly report that trails the weekly report by about two months generally affirms the direction of the weekly numbers.
The product supplied category for distillate in this past report stood at 2.809 million barrels/day. While that is not all diesel, it is the largest percentage of the category. That number is the lowest level since some of the darkest days of the pandemic. Excluding pandemic-impacted weeks, the product supplied figure for distillate was more akin to the types of numbers that might get recorded in the early ’90s.
A week earlier the product supplied number was 3.713 million b/d.
That drop got a lot of people’s attention. The weekly report is watched closely by traders to see signs of shift in demand, supply or inventories. Could that plunge in diesel demand mean the economy was slowing down?
But what the analysts did not realize is that the drop in demand for diesel that is reflected in the product supplied number was almost certainly a function of two things that managed to occur simultaneously: the Labor Day holiday and Roadcheck week.
The question is: What had the bigger impact, Labor Day or Roadcheck? Based on data in SONAR, it seems almost certain that it was Labor Day, with possibly a small impact from Roadcheck.
SONAR’s Outbound Tender Volume Index is the best measure to look at the impact. This year, on Sept. 6, the day before Labor Day, the OTVI stood at about 16125. A day later, on Labor Day, it was down 15.2% from the prior day. A week later it stood at 15990, down less than 1% from the day before Labor Day level.
If Roadcheck this year had a significant impact, it might be expected to be seen in comparison to Labor Day last year, when there was no Roadcheck week.
There was a small difference. But it was minimal enough that maybe it was Roadcheck week, but maybe it was just normal fluctuations. Between the Sunday of Labor Day weekend 2019 and Labor Day itself, the OTVI was down 15.2%, slightly more than this year. A week after Labor Day, volume was up 2.8% from the day before Labor Day, compared to this year’s less than 1% increase. The question is whether those differences are enough to cite Roadcheck as the cause of this year’s slightly bigger drop and slower recovery.
Meanwhile, Roadcheck 2019 was June 4-6, so it was not impacted by any holiday-driven changes in behavior like this year. The OTVI last year declined 1.5% between the day before Roadcheck and the first day of it. A week later, volume was down by 1.9%. Both those numbers occurred in a summer peak season that by all measures was weak, so the amount of blame to be heaped on Roadcheck might be too small to measure.
As far as the Outbound Tender Rejection Index, which would be expected to show drivers sitting out Roadcheck week, last year it rose to 5.03% on June 8, right after the week ended, up from 4.5% on June 3, the day before the enforcement action began. That doesn’t sound like much. But it’s a bit more than 500 basis points off a starting point of just 4500 basis points, so that could be seen as significant. OTRI this year was 25.02% on Sept. 1, took a small dip on Labor Day and then shot up to 26.68% by a week later.
Since OTRI measures capacity and it managed to rise despite a drop in volume, as seen in the declining OTVI, that appears to clearly look like a sign of drivers sitting out Labor Day week for whatever reason, pushing the index higher in a market already tight on capacity.
The question then is what did distillate/diesel “product supplied” do last year during Roadcheck week? It changed by levels within the normal swing of week-to-week numbers. During Labor Day week last year, it declined about 300,000 b/d. That’s a relatively significant one-week drop, though nowhere near the roughly 900,000 b/d reported last week that raised eyebrows in the oil market.
The weekly report of the reduced demand for diesel, regardless of how much it was impacted by Labor Day or Roadcheck, is not the only indication of the physical weakness in the diesel market.
Several stories in the business press have talked about a growing glut of diesel around the world. The excess is getting significant enough that around the world, refiners and traders are putting it into floating storage, able to sell it forward a year from now at a price that covers the storage costs and still allows a profitable sale.
A story written by Reuters’ well-known commodity writer John Kemp said refinery margins — the spread between diesel prices and the price of crude — are at “multi-decade lows.”
Measuring margins is always tricky; the points of comparison can differ. For example, the spread between the S&P Global Platts ULSD cargo price in North West Europe and the dated Brent crude oil benchmark sunk as low as between $41 and $42/b earlier this month, even as stories were being written about the global glut of diesel. But that’s still well above the lows of the pandemic, though the spread was closer to $60 before the pandemic began.
The most easily digested number for inventories in the U.S. is days cover, reached by taking inventory levels and dividing it by daily consumption. That number spent an unprecedented amount of time above 50 through much of the summer. In the most recent weekly report, it was just under that level. A number between 30 and 35 would be more typical.
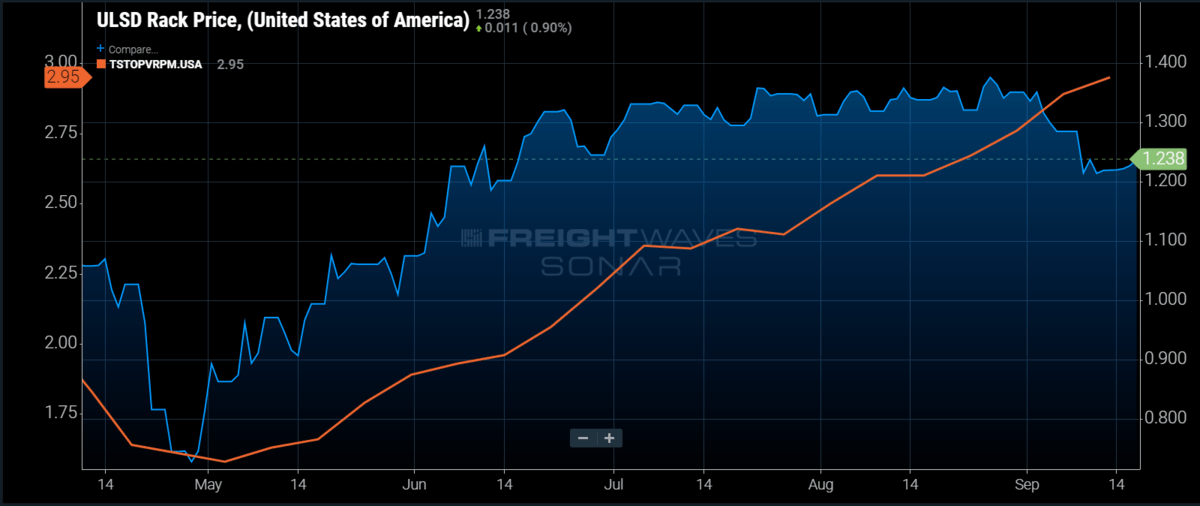
That is weighing on U.S. diesel margins. The spread between the CME price of ultra low sulfur diesel and the world’s Brent crude benchmark this past week was between 11-13 cts/gallon, one of the lowest levels all years. In the first two months of the year, it averaged close to 32 cts/gallon.
Put all of this together and the conclusion all comes up the same: There is little sign of any strength in the diesel market.
More articles by John Kingston
US losing oil refining capacity; renewable diesel to help close the gap
Refineries will continue to avoid jet output and favor diesel instead: report
Drilling Deep: New drivers aren’t coming out of CDL schools and that’s a problem
